
IAE Academy

GATE 2022 EC Q.31: solution and answer

GATE 2022 · ECQ.31 · 1 mark · NAT

The bar graph shows the frequency of the number of wickets taken in a match by a bowler in her career. For example, in 17 of her matches, the bowler has taken 5 wickets each. The median number of wickets taken by the bowler in a match is ________ (rounded off to one decimal place).
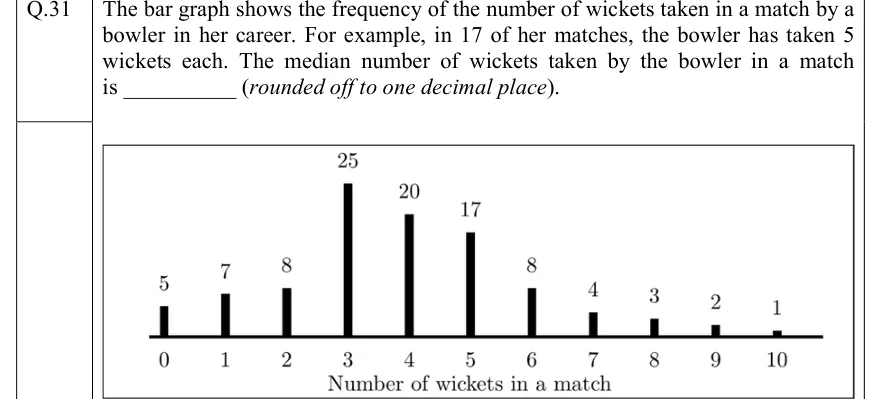
GATE 2022 EC question 31: Vertical bar graph.Tap to open full size
Figure from the GATE 2022 EC paper. It is part of the question.
Figure description

Vertical bar graph. Horizontal axis labelled 'Number of wickets in a match', with ticks 0, 1, 2, 3, 4, 5, 6, 7, 8, 9, 10. A bar stands above each tick with its frequency printed on top: 0 wickets: 5; 1 wicket: 7; 2 wickets: 8; 3 wickets: 25; 4 wickets: 20; 5 wickets: 17; 6 wickets: 8; 7 wickets: 4; 8 wickets: 3; 9 wickets: 2; 10 wickets: 1. There is no vertical axis scale; bar heights are proportional to the printed frequencies.

Answer and solution

ANSWER

The median number of wickets per match is 4.0.

Official answer: 4.0Source: Official answer key, GATE 2022 EC (IIT Kharagpur)

  1. Read the frequencies off the bars: for wickets.

  2. Total number of matches: .

  3. The data are discrete (a whole number of wickets per match), so the median is found by position. With even, it is the mean of the and ordered values, here the and observations.

  4. Cumulative frequencies: , , , , . So observations to all have .

  5. Both the and observations therefore equal , and the median is wickets.

KEY IDEA

For a discrete frequency distribution, add up the frequencies and find the value where the running total first reaches the middle position(s), and . Here , and the running total goes from 45 (up to 3 wickets) to 65 (up to 4 wickets), so the 50th and 51st values are both 4.

WATCH OUT FOR

One mistake is using the grouped-data interpolation formula with class to , which gives . That formula is for continuous class intervals, not for whole-number counts like wickets. Other slips are answering with the mode (3, the tallest bar), the middle axis value (5), or the median of the printed frequencies themselves.

From the GATE 2022 EC paper. Every question of this paper · Download the full paper · All 33 Probability & statistics questions, with notes

More Probability & statistics questions