
Which of the following plot(s) is(are) CORRECT for an enzyme that obeys Michaelis-Menten kinetics, assuming ?
is the concentration of the substrate, is the Michaelis constant, and is the initial reaction velocity.
 Tap to open full size
Figure description
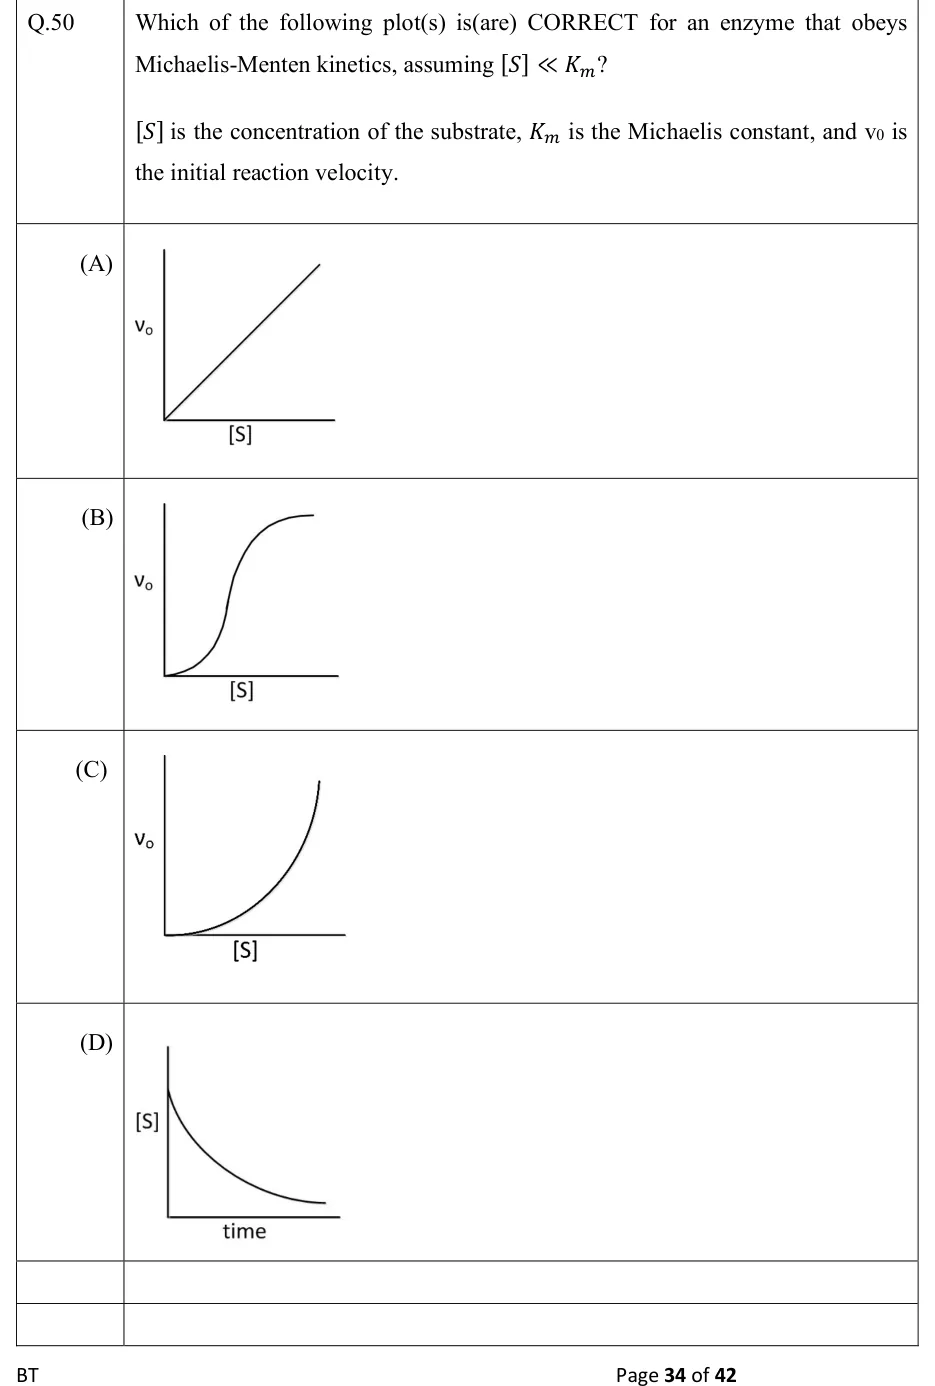
Each option is a sketch graph with no numbers on the axes. (A) Vertical axis v_0, horizontal axis [S]: a straight line that starts at the origin and rises at a constant slope. (B) Vertical axis v_0, horizontal axis [S]: a sigmoidal (S-shaped) curve that starts near the origin, stays flat at first, rises steeply in the middle and levels off to a plateau. (C) Vertical axis v_0, horizontal axis [S]: a curve that starts near the origin and bends upward (concave up), getting steeper as [S] grows, like a parabola or exponential. (D) Vertical axis [S], horizontal axis time: a curve that starts at a nonzero value on the [S] axis at time zero and falls, steeply at first and then more slowly, flattening out toward the time axis (a concave-up decay, like an exponential).
- (A)
Figure — (vertical) against (horizontal): a straight line through the origin with a constant positive slope.
- (B)
Figure — (vertical) against (horizontal): a sigmoidal curve, flat at first, rising steeply, then levelling off to a plateau.
- (C)
Figure — (vertical) against (horizontal): a concave-up curve from near the origin that gets steeper as increases.
- (D)
Figure — (vertical) against time (horizontal): a curve starting at a nonzero at time zero and decaying, steeply at first and then more slowly, toward the time axis.