
IAE Academy

GATE 2018 IN GA Q.10: solution and answer

GATE 2018 · INGA Q.10 · 2 marks · MCQ

In a detailed study of annual crow births in India, it was found that there was relatively no growth during the period 2002 to 2004 and a sudden spike from 2004 to 2005. In another unrelated study, it was found that the revenue from cracker sales in India which remained fairly flat from 2002 to 2004, saw a sudden spike in 2005 before declining again in 2006. The solid line in the graph below refers to annual sale of crackers and the dashed line refers to the annual crow births in India. Choose the most appropriate inference from the above data.
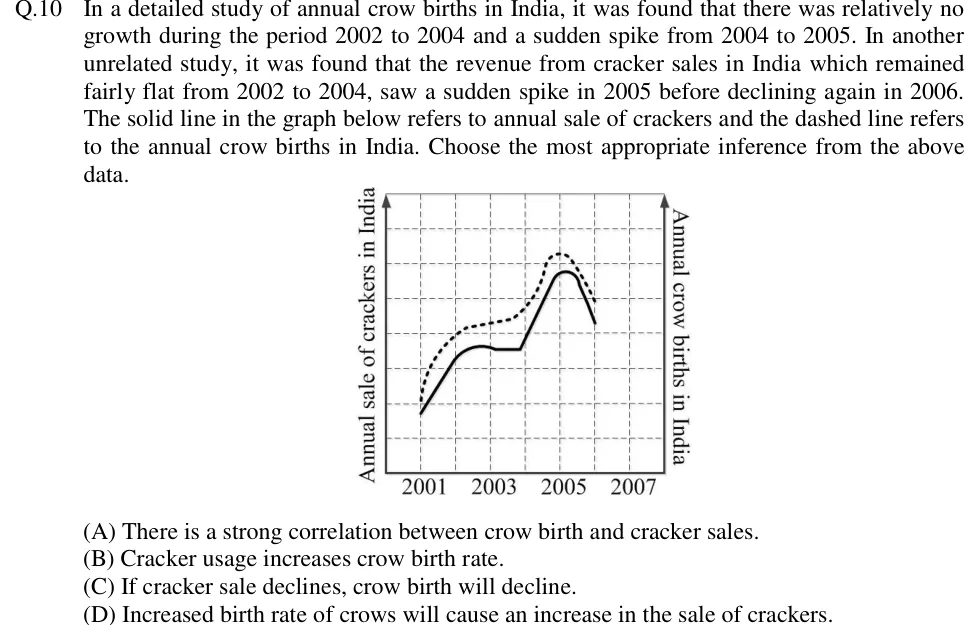
GATE 2018 IN GA question 10: A line graph on a dashed square grid.Tap to open full size
Figure from the GATE 2018 IN paper. It is part of the question.
Figure description

A line graph on a dashed square grid. The horizontal axis is marked 2001, 2003, 2005, 2007 below it, with one vertical grid line per year (2001 to 2007). The left vertical axis (arrow pointing up) is labelled 'Annual sale of crackers in India'. The right vertical axis (arrow pointing up) is labelled 'Annual crow births in India'. Neither vertical axis has numbers on it. The SOLID line (cracker sales) starts low at 2001 and rises in a straight line to 2002. It keeps rising a little into a slight hump between 2002 and 2003, then runs flat until just before 2004. It then climbs steeply to a peak just after 2005 and falls sharply to 2006, where it ends. The DASHED line (crow births) lies above the solid line the whole way. It starts at 2001 slightly above the solid line's start, rises steeply to about 2002, creeps up only slightly from 2002 to 2004, climbs steeply to a peak at about 2005 (higher than the solid peak) and falls to 2006, where it ends. The two curves rise, level off, peak and fall in the same years.

  1. (A)

    There is a strong correlation between crow birth and cracker sales.

  2. (B)

    Cracker usage increases crow birth rate.

  3. (C)

    If cracker sale declines, crow birth will decline.

  4. (D)

    Increased birth rate of crows will cause an increase in the sale of crackers.

Answer and solution

ANSWER

The correct option is (A). The graph shows only that crow births and cracker sales rise and fall together (a strong correlation). It gives no basis for a cause-and-effect claim or a prediction about one from the other.

Official answer: ASource: Official answer key, GATE 2018 IN (IIT Guwahati)

  1. Read the graph first. The solid line (cracker sales) and the dashed line (crow births) both rise from 2001 to 2002, stay nearly flat from 2002 to about 2004, jump to a peak at 2005 and fall in 2006. The stem's own text says the same about both studies: flat from 2002 to 2004, then a sudden spike in 2005. The two series move up and down together.

  2. Two quantities that consistently rise and fall together are correlated. Here the match holds in every stretch (the rise, the plateau, the spike and the fall), so the correlation is strong. That is exactly what option (A) says, and it only describes the data.

  3. Now test the other options. The stem says the two sets of figures come from unrelated studies. Nothing in them links crows to crackers or explains how one could affect the other.

  4. Correlation does not imply causation. Moving together does not tell us which quantity drives the other, or whether either one does. A shared outside factor, or plain coincidence, could produce the same curves.

  5. (B) says cracker usage increases crow births, and (D) says crow births increase cracker sales. Each claims a cause in one direction, which the data cannot show, so both are rejected. (B) also talks about cracker usage, while the graph shows only sales.

  6. (C) says that whenever cracker sales fall, crow births will fall too. That claims crow births depend on cracker sales and must follow them in future. It is a cause-and-effect or predictive claim, and six years of co-movement between two unrelated series cannot establish it. Rejected.

  7. The only claim the data actually support is the co-movement itself, so the answer is (A).

KEY IDEA

When two series move up and down together on a graph, that shows correlation and nothing more. It cannot show that either one causes the other, in either direction, and it gives no rule for predicting one from the other. Here the two series also come from unrelated studies, which makes this even clearer.

WATCH OUT FOR

Picking (B) or (C) because the two curves match so closely. That reads a cause-and-effect link, or a rule for predicting one series from the other, into what is only co-movement between two series from unrelated studies.

From the GATE 2018 IN paper. Every question of this paper · Download the full paper · All 9 Data interpretation questions, with notes

More Data interpretation questions