IAE Academy

EVERY GATE PAPER

Data interpretation

Data interpretation questions present figures as a bar graph, pie chart, line graph, histogram, table, scatter or contour plot, or map, and ask for a quantity derived from them: a share, a percentage change, a ratio, an average or a growth rate. The arithmetic is usually short and answers go wrong in the reading instead (the wrong base for a percentage, a cumulative value taken as a yearly one, a unit or an axis scale missed), so these notes pair every standard result with the reading discipline it needs.

9 previous-year questions · 9 solved · 5 practice questions

1. Reading a data display before calculating

Every data-interpretation question is two jobs done in order: read the display correctly, then do a short calculation. The calculation is seldom hard; the reading is where answers go wrong. Before using any number, settle what is measured, in what unit, over what period and against what base.

Conventions used in these notes. A percentage change is taken on the ORIGINAL (earlier) value unless the question names another base. A profit or loss percentage is taken on the expenditure (the cost) unless the question names another base. 'The increase from year X to year Y' means the value in Y minus the value in X, so a decrease comes out negative. Angles are in degrees. Money is in Rs., with 1 lakh and 1 crore , and large numbers use Indian digit grouping (1,00,000). 'At least' and 'at most' are inclusive; 'more than', 'less than' and 'exceeds' are strict.

The first read of any chart or table, in order

  1. Read the title and every note printed with the display: what is measured, for whom and over what period.

  2. Read each axis label or column heading for its quantity and unit (thousands, lakhs, crores, tonnes, per cent, Rs. per kg). Under a heading 'Rs. lakh', an entry 12.5 means Rs. 12,50,000.

  3. Find the gridline interval from two labelled ticks before estimating anything between gridlines: labels 0 and 50 with four gaps between them make each gap 12.5.

  4. Check where the value axis starts and how it is scaled. Bar lengths are proportional to values only when the axis is linear and starts at zero; on an offset, broken or logarithmic axis, compare the values read off, never the heights.

  5. Read the legend: which colour, pattern or marker is which series. On a dual-axis chart, note which series is read against the left axis and which against the right.

  6. Decide what kind of values are plotted: absolute amounts, percentages of a total, or cumulative (running) totals.

  7. Read the question for its base and its period ('percentage of what', 'change from when to when', 'per what') and write the base down before dividing.

  8. Look at the options before calculating. If they are far apart, round boldly; if two are close, or the answer is numerical (NAT), calculate exactly.

Data displays and how to read them

Display

What it shows

How to read a value

Typical trap

Simple bar graph

One quantity across categories or periods

Height (or length) of the bar against the value axis

An axis that does not start at zero exaggerates the differences between bars

Grouped (clustered) bar graph

Two or more series side by side for each category

Each bar separately, against the same axis

Reading the wrong series; check the legend

Stacked bar graph

Parts of a total, stacked in one bar

Segment = reading at its upper edge minus reading at its lower edge; the top of the bar is the total

Taking the upper edge of a middle segment (a running total) as that segment's value

100% stacked bar graph

Each part as a percentage of its own bar's total

Segment height = percentage share

The bars may stand for different totals, so equal segments need not be equal amounts

Pie chart

Parts of one whole

Part = (angle / 360°) × total, or (percentage / 100) × total

Comparing angles across two pies that have different totals

Line graph

A quantity against an ordered variable, usually time

Height of each point; the slope of a segment is the rate of change

Visual steepness depends on the axis scales; a cumulative line is not a per-period line

Histogram

How many items fall in each class interval of a continuous variable; the bars touch

Equal class widths: bar height = frequency. Unequal widths with a frequency-density axis: frequency = height × class width

Reading heights as frequencies when the class widths differ

Table

Exact values in rows and columns

Direct look-up of a cell

Reading a total row as an entry; mixed units across columns; a blank or 'NA' cell is not zero

Scatter plot

One point (x, y) per item

Coordinates of the point; y/x is the slope of the line from the origin to it

The ratio y/x of a point is not the slope of the trend of all the points

Dual-axis chart

Two series with different units on one chart

Each series against its own axis

Reading a series against the other axis

Contour plot, heat map or 3-D surface

A quantity z over a plane of (x, y) values

Each contour line joins points of equal z; a heat-map colour stands for a range of z

Close spacing of contours means fast change, not a high value

Map

Locations, distances and regions, or data shaded by region

Ground distance = map distance × scale factor

Area scales with the square of the linear scale; take north as the top only when there is no north arrow, otherwise follow the arrow

3-D EFFECTS HIDE THE DATA

A 3-D bar chart or tilted 3-D pie adds depth for appearance only. In a tilted pie the front sectors look larger than their angles justify, and in a perspective bar chart heights are hard to read against the back gridlines. Use the printed values, percentages or angles, never the visible area.

2. Percentages, percentage points and ratios

A percentage is a ratio scaled so that the denominator is 100, so every percentage has a base: the quantity it is a percentage OF. Most traps in this topic change the base quietly: a share of the whole versus a share of one group, a change measured from the old value versus from the new one, or a change in a rate versus a change in the count behind the rate.

PERCENTAGE SHARE

For parts of one whole (a pie, a stacked bar, a column of a table with its total). The shares of all the parts add to 100%, apart from rounding in the display.

PERCENTAGE CHANGE

The base is the old (earlier) value unless the question names another. A positive result is an increase and a negative one a decrease. For a quantity that cannot go below zero, a decrease can never exceed 100%; an increase can (a rise of 100% is a doubling).

PERCENTAGE-POINT CHANGE

For a change in a quantity that is itself a percentage (a share, a pass rate, an interest rate). From 20% to 25% is a rise of 5 percentage points, but a 25% increase in the rate, because .

MORE THAN AND LESS THAN

For positive and with . The base is the quantity after 'than'. The two percentages differ: with and , is 25% more than but is 20% less than .

CONVERTING 'MORE THAN' INTO 'LESS THAN', AND RECOVERING A FALL

The first holds for any ; the second for . A 25% rise is undone by a 20% fall, and a 20% fall needs a 25% rise to recover.

SUCCESSIVE PERCENTAGE CHANGES

Each change acts on the value left by the previous one. Take a decrease as negative. The order of the changes does not affect the final value.

NET EFFECT OF TWO SUCCESSIVE CHANGES

For changes of then , decreases negative. A rise of 20% followed by a fall of 20% gives , a net fall of 4%. The same result gives the change in a product: price up 10% and quantity sold down 10% changes revenue by , a 1% fall.

ORIGINAL VALUE FROM A CHANGED VALUE (REVERSE PERCENTAGE)

When the value after a change of is known ( negative for a decrease, with ). A value of 132 after a 10% rise was , not .

PROFIT PERCENTAGE FROM INCOME AND EXPENDITURE

The base is the expenditure (the cost) unless the question names another; a negative result is a loss. Rearranged, Income Expenditure for a profit of . An income of Rs. 69 lakh on an expenditure of Rs. 60 lakh is a profit of .

SHARE OF A SHARE

For nested data: if 40% of a firm's staff are engineers and 25% of the engineers are women, women engineers are of the staff.

RATIO OF TWO SHARES OF THE SAME TOTAL

When and are and of the SAME total, their ratio needs no total. It fails in general across two different totals (two pies, two years): convert to amounts first.

DIVIDING A TOTAL IN A GIVEN RATIO

Each part is its term of the ratio over the sum of the terms. Rs. 9 lakh divided in the ratio gives Rs. 2 lakh, Rs. 3 lakh and Rs. 4 lakh.

The wording fixes the base

Wording in the question

Base (denominator)

Calculation

A as a percentage of B

B

Share of A in the total

The total

By what percentage is A more than B?

B

By what percentage is B less than A?

A

Percentage change from 2023 to 2024

The 2023 value

Profit percentage

The expenditure

Change in a rate from 30% to 39%

None: subtract

percentage points

Percentage change in a rate from 30% to 39%

The old rate, 30

WORKED EXAMPLE · PERCENTAGE POINTS VERSUS PER CENT

A college received 1200 applications in 2024, of which 360 were from women. In 2025 it received 1400 applications, of which 546 were from women. Find (a) the change in the women's share of applications, in percentage points; (b) the percentage increase in the number of applications from women; (c) the percentage increase in the women's share itself.

Solution
  1. Share in 2024 . Share in 2025 .

  2. (a) Change in share percentage points.

  3. (b) Increase in number , so the percentage increase .

  4. (c) Relative change in the share .

  5. Check: the count grows by the factor (share factor) × (total factor) , which agrees with (b).

  6. Three differently worded questions, three different correct answers. Decide which one is asked before calculating.

Answer: (a) 9 percentage points; (b) about 51.67%; (c) 30%.

A CHANGE IN A SHARE IS NOT A CHANGE IN THE COUNT

When a share rises while the total also changes, the count behind the share can move by a very different percentage (Example above: share up 30%, count up about 51.67%). A share can even fall while the count rises, if the total grows faster.

3. Pie charts, stacked bars and 100% bars

A pie chart shows how ONE total is divided. The whole circle is , so each sector's angle is its share of ; when the chart prints percentages instead, the whole is 100%. A stacked bar does the same job along a line: the segments sit one on top of another and the top of the stack is the total. A 100% stacked bar rescales every bar to the same height, so it shows shares, not amounts.

SECTOR ANGLE

is the part's percentage share. 1% corresponds to , 10% to , 25% to and 50% to .

VALUE AND PERCENTAGE FROM AN ANGLE

Needs the total of THAT pie. The angles of all the sectors add to and their percentages to 100.

RATIO OF TWO SECTORS OF ONE PIE

Only within one pie. Across two pies, convert each sector to an amount using its own pie's total first. The difference between two sectors is .

SEGMENT OF A STACKED BAR

The bottom segment's lower edge is zero. The upper edge of any higher segment is a running total, not that segment's value. The top of the whole stack is the total of all segments.

AMOUNT FROM A 100% STACKED BAR

The bar totals must come from elsewhere (a table or a label). Without them, segments of different bars can be compared only as shares.

WORKED EXAMPLE · PIE CHART WITH A CHANGE

A family's monthly income of Rs. 48,000 is divided as shown by a pie chart: Rent , Food , Education , Transport , and Savings the remaining sector. The next month the rent rises by 10%. Income and the spending on food, education and transport are unchanged, and savings absorb the whole rise. Find the savings before and after the rise, the new angle of the savings sector, and the percentage fall in savings.

Solution
  1. Savings angle .

  2. Savings Rs. 7,200. Rent Rs. 14,400.

  3. Rise in rent of 14,400 Rs. 1,440, so new savings Rs. 5,760.

  4. New savings angle . Check: the rent sector grows by , and .

  5. Percentage fall in savings . A 10% change in one sector has produced a 20% change in another, because the two sectors have different bases.

Answer: Savings fall from Rs. 7,200 to Rs. 5,760, a 20% fall; the savings sector shrinks from to .

TWO PIES, TWO TOTALS

Equal angles in two different pie charts mean equal SHARES, not equal amounts. A sector of a Rs. 40 lakh budget is Rs. 10 lakh; a sector of a Rs. 60 lakh budget is Rs. 15 lakh. A sector can shrink in angle while its amount grows, if the total grows enough.

ANGLE TO PERCENTAGE IN ONE STEP

Divide the angle by 3.6: is 15%, is 35%, is 55%. Multiply a percentage by 3.6 for the angle.

4. Change over time: line graphs, growth rates and CAGR

A line graph plots a quantity against an ordered variable, usually time. The height of a point is the value; the slope of a segment is the rate of change in units per period. Two different questions hide here. The largest ABSOLUTE increase is the biggest rise in value (the steepest rising segment, when the periods are equal). The largest PERCENTAGE increase is the biggest rise relative to the starting value. They often fall in different periods, because the same rise is a larger percentage of a smaller base.

AVERAGE RATE OF CHANGE

In units per period (for example tonnes per year). On a line graph it is the slope of the segment joining the two points, computed from the axis values. How steep a segment looks depends on the scales chosen for the axes.

YEAR-ON-YEAR GROWTH RATE

The percentage change over one period, on the earlier value as base. A falling growth rate does not mean a falling value: a line that keeps rising but flattens has positive, shrinking growth rates.

COMPOUND GROWTH AT A CONSTANT RATE

Growth of in each of periods, each period's growth applied to the value at the start of that period. For a steady decline, is negative.

COMPOUND ANNUAL GROWTH RATE (CAGR)

For positive and . is the number of periods BETWEEN the two values: from 2020 to 2025, , not 6. CAGR is the constant rate that would carry to ; it ignores the path in between.

CAGR FROM THE YEARLY RATES

The CAGR comes from the geometric mean of the growth factors. Provided every yearly rate is above (no value falls to zero), it never exceeds the arithmetic mean of the yearly rates , and the two are equal only when every yearly rate is the same.

SIMPLE AVERAGE ANNUAL GROWTH (ON THE STARTING VALUE)

Use only when a question asks for the average yearly increase as a percentage of the starting value (simple, not compound). For positive and it is never smaller than the CAGR over the same span, and equals it only when or .

INDEX NUMBER

The base period has index 100. The difference is a percentage change only when the earlier period is the base (). Indices of 125 and 150 differ by 25 points but mean a rise of .

PER-PERIOD VALUE FROM CUMULATIVE DATA

When a graph or table shows running totals ('total sales up to month '), the value for period is the difference of consecutive readings. A running total of non-negative amounts never falls, so a line that falls anywhere is not a cumulative line of such amounts.

WORKED EXAMPLE · YEARLY RATES, THEIR MEAN AND THE CAGR

A line graph shows a company's revenue, in Rs. crore: 250 in 2021, 300 in 2022, 330 in 2023 and 396 in 2024. Find the year-on-year growth rates, their arithmetic mean, the CAGR from 2021 to 2024, and the year with the largest absolute increase.

Solution
  1. Growth in 2022 ; in 2023 ; in 2024 .

  2. Arithmetic mean of the three rates .

  3. From 2021 to 2024 there are periods, and , the same as .

  4. Since and , the cube root of 1.584 is about 1.1657, so CAGR : slightly below the arithmetic mean, as it must be when the yearly rates differ.

  5. Absolute increases: 50, 30 and 66 crore, so the largest is in 2024. The largest percentage increase (20%) is shared by 2022 and 2024.

Answer: Rates 20%, 10%, 20%; mean about 16.67%; CAGR about 16.57%; largest absolute increase in 2024 (Rs. 66 crore).

PERCENTAGE CHANGES DO NOT ADD

A rise of 10% followed by another 10% is a rise of 21%, not 20%. A fall of 50% followed by a rise of 50% leaves 75% of the start, a net fall of 25%. Multiply the growth factors.

DOUBLING-TIME ESTIMATE

At a steady per period, a quantity roughly doubles in periods. This is an approximation, within about 2% of the exact value for rates from 4% to 12% and less accurate outside that range. Use it to eliminate options, never for a NAT answer.

5. Averages, weighted averages and ratios of totals

Averages from data come in two kinds. A simple mean treats every item equally. A weighted mean counts each value in proportion to its size: the overall pass rate of several sections, the average price of items sold in different quantities, the average output of plants with different workforces. Averaging percentages or ratios directly is correct in general only when every group has the same base.

The median is the middle value after the data are arranged in order (the mean of the two middle values when the number of items is even), and the mode is the most frequent value. A single very large or very small value can shift the mean a long way but moves the median little or not at all.

ARITHMETIC MEAN

Each item counts equally. Rearranged, sum of values , which recovers a missing value when the mean of all the items is given.

WEIGHTED MEAN

The weights are the group sizes (students, units sold, workers). With positive weights, the weighted mean always lies between the smallest and largest , pulled towards the values with larger weights. For a frequency table the weights are the frequencies; for grouped classes, taking each class mid-point as gives an estimate of the mean, not its exact value.

COMBINED PERCENTAGE OF SEVERAL GROUPS

is group 's percentage and its size. The plain mean of the equals whenever all the are equal; otherwise it generally differs.

TWO-GROUP WEIGHTED MEAN AND ALLIGATION

The combined mean divides the gap between the two group values in the inverse ratio of the weights. The second form finds the ratio of group sizes from a known combined mean and needs . Groups with means 60 and 80 in sizes have combined mean .

RATIO OF TOTALS VERSUS AVERAGE OF RATIOS

An overall rate (revenue per unit sold, output per worker, marks per student) is total divided by total. In general the mean of the individual ratios is a different number; the two agree when all the are equal.

WORKED EXAMPLE · OVERALL PASS PERCENTAGE

A table gives the number of students and the pass percentage in three sections of a course. Section P: 40 students, 90% passed. Section Q: 60 students, 75% passed. Section R: 50 students, 60% passed. Find the overall pass percentage and compare it with the mean of the three percentages.

Solution
  1. Students who passed: P , Q , R . Total passed out of .

  2. Overall pass percentage . As a weighted mean: .

  3. Plain mean of the three percentages . It overstates the overall rate by 1 percentage point because the section with the lowest pass rate, R (50 students), is larger than the section with the highest, P (40 students): R pulls the weighted mean down by more than P pulls it up.

Answer: 74%. The plain mean of the percentages (75%) is not the overall pass percentage.

AVERAGES OF AVERAGES

Whenever a question asks for an 'overall' or 'combined' average, rate or percentage, go back to totals: total passes over total students, total revenue over total units. The average of group averages is guaranteed to be right only when the groups are the same size.

6. Tables, histograms, scatter plots, 3-D and contour plots, and maps

Tables give exact values, so errors come from picking the wrong cell: a total row read as an entry, a column in thousands mixed with one in lakhs, or a blank or 'NA' cell read as zero. Before reading, scan every heading for its unit and look for total rows and columns; a printed total is also a free check on your own addition.

Histograms show how many items fall in each class interval of a continuous variable, with the bars touching. Read the class boundaries from the horizontal axis first. When all the classes are equally wide, the height of each bar is its frequency. When the widths differ and the vertical axis is labelled frequency density (frequency per unit of class width), the AREA of a bar is its frequency.

Scatter plots show one point per item, with one variable on each axis. When both axes start at zero, the ratio for a point is the slope of the straight line from the origin to that point: points on one line through the origin share the same ratio, and a point above the line has a ratio greater than (for ). A general upward drift of the points shows that the two quantities tend to rise together; it does not show that one causes the other.

FREQUENCY FROM A HISTOGRAM WITH UNEQUAL CLASSES

A bar of height 6 per unit over the class 20 to 30 stands for items. Comparing the heights of bars of different widths compares densities, not frequencies.

RATIO FROM A POINT OF A SCATTER PLOT

Holds only when the plotted origin really is . If either axis is offset (starts above zero), compute from the values read off instead.

Two- and three-dimensional plots. A 2-D plot shows one quantity against another (a line graph or a scatter plot). A 3-D plot shows a quantity that depends on two variables and : drawn in perspective as a surface, or flattened into a contour plot, a map of the plane on which each contour line joins points with the same value of . A heat map does the same with colours, each colour standing for a range of .

Adjacent contour lines differ by a fixed contour interval. Where the lines crowd together changes quickly (a steep slope); where they are far apart it changes slowly. Two contour lines of different values never meet or cross, because a point has only one value of . A set of closed rings with values increasing inwards marks a peak; values decreasing inwards mark a hollow.

AVERAGE GRADIENT FROM A CONTOUR MAP

Both in the same unit. The horizontal distance is the ground distance, so convert the map distance with the scale first. Often written as '1 in ', meaning a rise of 1 unit for every units horizontally.

Maps. A map is a scaled drawing of an area. The scale may be a ratio ( means 1 cm on the map is 50,000 cm, i.e. 0.5 km, on the ground), a statement ('1 cm to 2 km') or a scale bar. Unless a north arrow shows otherwise, north is at the top, east to the right, south at the bottom and west to the left; NE, SE, SW and NW lie from their neighbouring cardinal directions. A data map shades regions by class intervals given in its legend, so two regions in the same shade may differ by up to the width of a class.

DISTANCE ON A MAP

Convert units last: 1 km m cm.

AREA ON A MAP

Areas scale with the SQUARE of the linear scale. On a map, 1 cm represents 0.5 km, so 1 cm² represents km².

WORKED EXAMPLE · CONTOUR MAP AND SCALE

On a map drawn to a scale of , a straight path runs from point A on the 120 m contour line to point B on the 220 m contour line, and measures 8 cm on the map. The ground rises steadily from A to B, and the contour interval is 20 m. Find (a) the number of contour intervals the path crosses, (b) the ground distance from A to B, (c) the average gradient of the path, and (d) the ground area of a field that occupies 6 cm² on the same map.

Solution
  1. (a) Rise m, so the path crosses contour intervals.

  2. (b) Ground distance cm km m.

  3. (c) Average gradient , i.e. 1 in 20, or 5%.

  4. (d) 1 cm on the map is 25,000 cm km, so 1 cm² is km², and the field is km². Using the linear scale only once would give the wrong .

Answer: (a) 5; (b) 2 km; (c) 1 in 20 (5%); (d) 0.375 km².

DUAL AXES

On a chart with a left and a right axis, first match each series to its axis from the legend or the axis labels. A crossing of the two lines means nothing by itself: the lines are drawn against different scales, often in different units, and rescaling either axis would move the crossing or remove it.

7. Estimation and the common traps

A value read by eye from a graph is uncertain by a fraction of a gridline, and exact arithmetic on it is false precision. What matters is whether the options can tell your estimate apart. Carry the reading uncertainty through: if it cannot change which option is nearest, estimate; if it can, read more carefully and calculate exactly.

Estimation rules

  1. Rounding every number to two significant figures can shift a ratio by up to about 10%; rounding to three, by up to about 1%. Use two only when the options differ by 25% or more, three when they differ by about 5% or more, and exact values when two options are closer than that or the answer is NAT.

  2. When rounding a ratio, move numerator and denominator in the SAME direction (both up or both down); rounding them in opposite directions adds the two errors.

  3. Compare two fractions by cross-multiplying: for positive and , exactly when .

  4. Use fraction equivalents: , , 12.5% , , , , 37.5% , 62.5% , .

  5. Read a growth factor instead of subtracting then dividing: means an 18% increase, and 0.93 means a 7% decrease.

  6. For small changes of and in two quantities, their product changes by about and their ratio by about . The exact changes are per cent for the product and per cent for the ratio; use the exact forms whenever or is large or the answer is NAT.

THE BASE TRAP

'What percentage of the total is A?', 'By what percentage is A more than B?' and 'By what percentage did A grow?' have three different denominators. Write the base down before dividing.

CUMULATIVE VERSUS PER-PERIOD

Check whether a line or column shows running totals ('till date', 'up to', 'cumulative'). The value for one period is then the difference of two consecutive readings, and the last reading is the grand total, not the final period's value.

UNITS AND SCALE

Look for mixed units (thousands in one column, lakhs in another), a secondary axis, and a broken axis. An axis labelled 1, 10, 100, 1000 at equal spacing is logarithmic: equal gaps there mean equal RATIOS, not equal differences.

INCREASE BY VERSUS INCREASE TO

'Increased by 200%' means the new value is 3 times the old; 'increased to 200%' means it is 2 times the old, an increase of 100%.

ROUNDED DISPLAYS

Percentages printed on a pie or a table may be rounded, so they can add to 99% or 101%. Do not treat that as an error in the data, and do not assume the unrounded values when the question does not give them.

PREVIOUS-YEAR QUESTIONS

9 questions from the EC, EE and IN papers

Try each question first, then open the answer. We placed each question under a topic ourselves; the exam paper does not label topics.

See these papers in full: GATE ECE 2025 · GATE ECE 2024 · GATE ECE 2020 · GATE EE 2024 · GATE EE 2020 · GATE IN 2025 · GATE IN 2024 · GATE IN 2020 · GATE IN 2018

GATE 2025 EC GA Q.9

GATE 2025 · ECGA Q.9 · 2 marks · MCQ

The table lists the top 5 nations according to the number of gold medals won in a tournament; also included are the number of silver and the bronze medals won by them. Based only on the data provided in the table, which one of the following statements is INCORRECT?

GATE 2025 EC GA question 9: A table with four columns headed Nation, Gold, Silver, Bronze, and five data rows in this order: USA: Gold 40, Silver…Tap to open full size
Figure from the GATE 2025 EC paper. It is part of the question.
Figure description

A table with four columns headed Nation, Gold, Silver, Bronze, and five data rows in this order: USA: Gold 40, Silver 44, Bronze 41. Canada: Gold 39, Silver 27, Bronze 24. Japan: Gold 20, Silver 12, Bronze 13. Australia: Gold 17, Silver 19, Bronze 16. France: Gold 16, Silver 26, Bronze 22.

  1. (A)

    France will occupy the third place if the list were made on the basis of the total number of medals won.

  2. (B)

    The order of the top two nations will not change even if the list is made on the basis of the total number of medals won.

  3. (C)

    USA and Canada together have less than 50% of the medals awarded to the nations in the above table.

  4. (D)

    Canada has won twice as many total medals as Japan.

Answer and solution
GATE 2025 EC GA Q.9: answer and solution

GATE 2025 IN GA Q.8

GATE 2025 · INGA Q.8 · 2 marks · MCQ

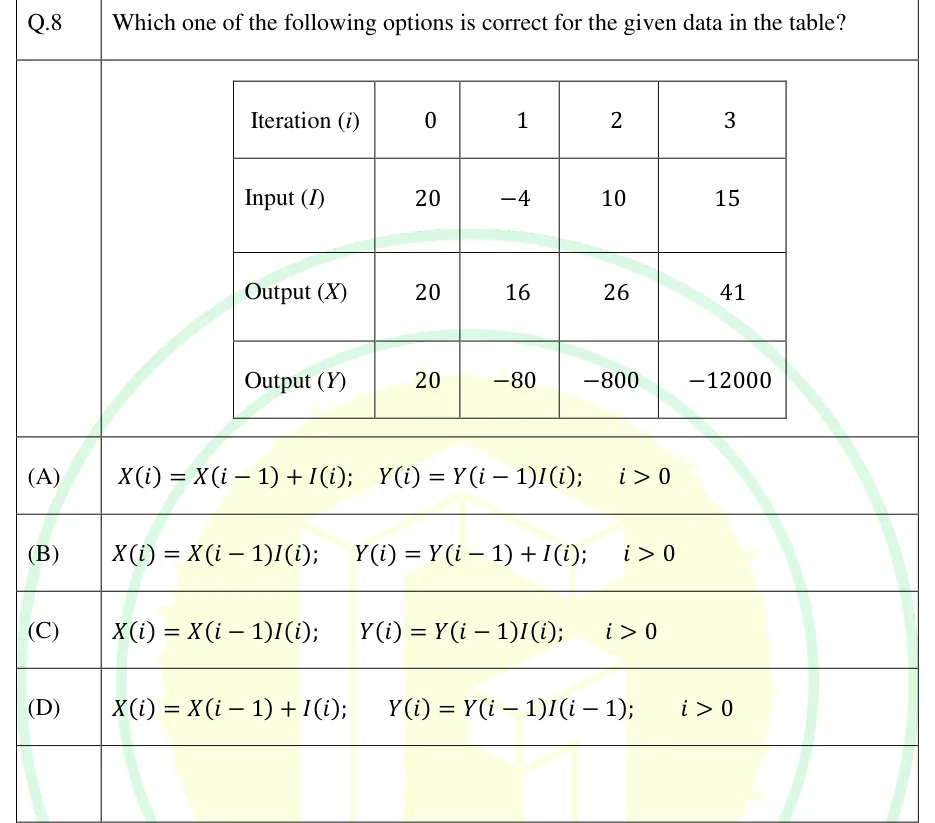
Which one of the following options is correct for the given data in the table?

| Iteration | 0 | 1 | 2 | 3 |
|---|---|---|---|---|
| Input | 20 | | 10 | 15 |
| Output | 20 | 16 | 26 | 41 |
| Output | 20 | | | |

GATE 2025 IN GA question 8: A table with 4 rows and 5 columns.Tap to open full size
Figure from the GATE 2025 IN paper. It is part of the question.
Figure description

A table with 4 rows and 5 columns. The first column holds the row labels and the header row gives the iteration number. Row 1: Iteration (i) = 0, 1, 2, 3. Row 2: Input (I) = 20, -4, 10, 15. Row 3: Output (X) = 20, 16, 26, 41. Row 4: Output (Y) = 20, -80, -800, -12000.

  1. (A)

  2. (B)

  3. (C)

  4. (D)

Answer and solution
GATE 2025 IN GA Q.8: answer and solution

GATE 2024 EC GA Q.8

GATE 2024 · ECGA Q.8 · 2 marks · MCQ

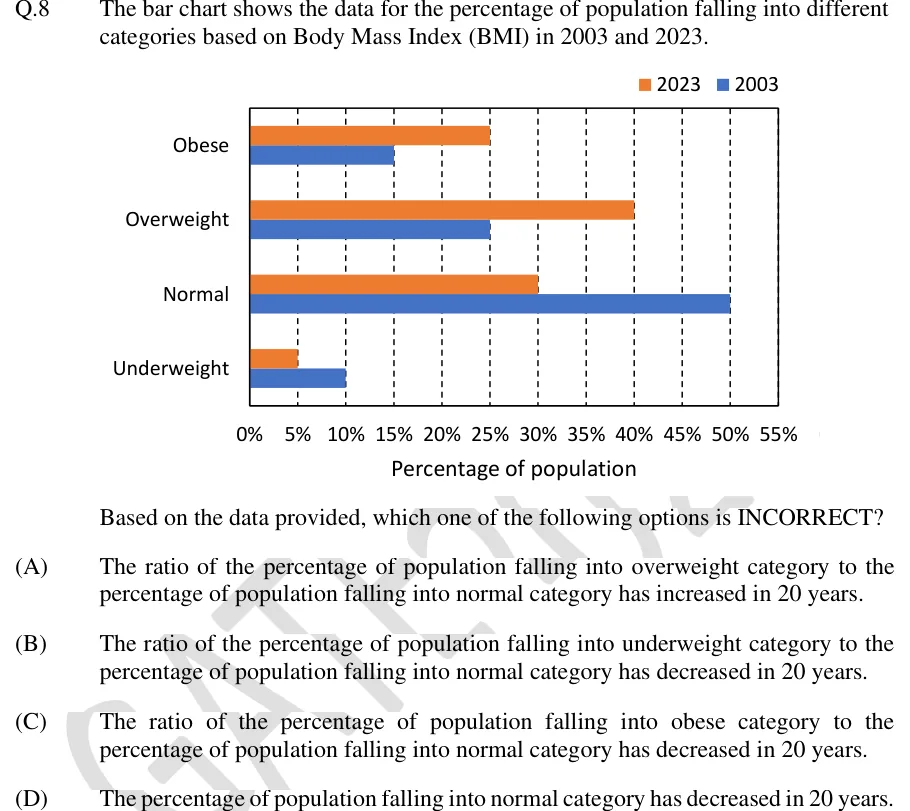
The bar chart shows the data for the percentage of population falling into different categories based on Body Mass Index (BMI) in 2003 and 2023.

[Bar chart]

Based on the data provided, which one of the following options is INCORRECT?

GATE 2024 EC GA question 8: Horizontal clustered bar chart.Tap to open full size
Figure from the GATE 2024 EC paper. It is part of the question.
Figure description

Horizontal clustered bar chart. Legend at top right: orange square = 2023, blue square = 2003. Vertical axis lists four BMI categories, top to bottom: Obese, Overweight, Normal, Underweight. Each category has two horizontal bars, the orange (2023) bar above the blue (2003) bar, both starting at 0%. Horizontal axis titled 'Percentage of population', labelled 0%, 5%, 10%, 15%, 20%, 25%, 30%, 35%, 40%, 45%, 50%, 55%, with dashed vertical gridlines at every 5%. Bar values (each ends exactly on a gridline): Obese: 2023 = 25%, 2003 = 15%. Overweight: 2023 = 40%, 2003 = 25%. Normal: 2023 = 30%, 2003 = 50%. Underweight: 2023 = 5%, 2003 = 10%. Each year's four values sum to 100%.

  1. (A)

    The ratio of the percentage of population falling into overweight category to the percentage of population falling into normal category has increased in 20 years.

  2. (B)

    The ratio of the percentage of population falling into underweight category to the percentage of population falling into normal category has decreased in 20 years.

  3. (C)

    The ratio of the percentage of population falling into obese category to the percentage of population falling into normal category has decreased in 20 years.

  4. (D)

    The percentage of population falling into normal category has decreased in 20 years.

Answer and solution
GATE 2024 EC GA Q.8: answer and solution

GATE 2024 EE GA Q.8

GATE 2024 · EEGA Q.8 · 2 marks · MCQ

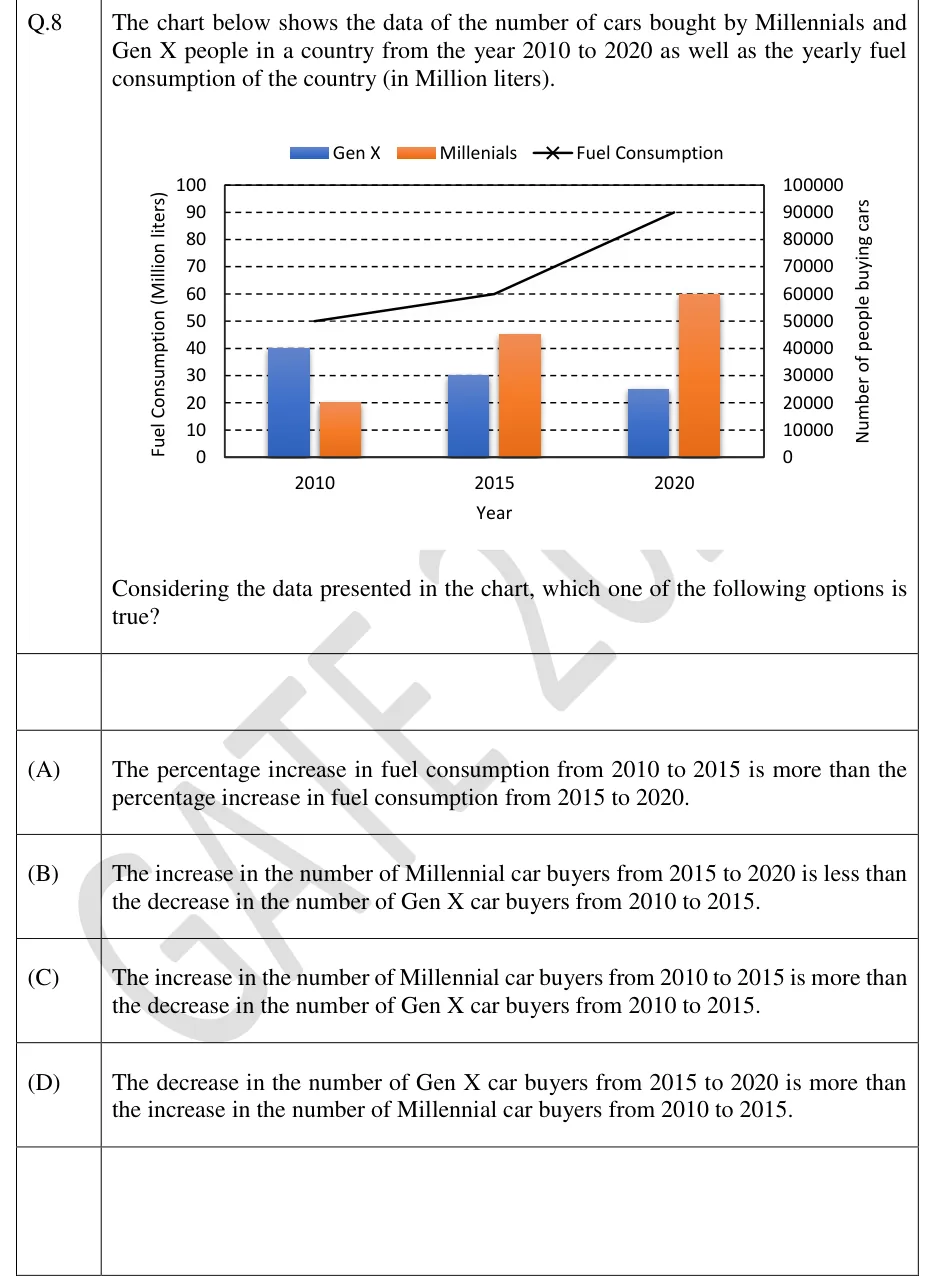
The chart below shows the data of the number of cars bought by Millennials and Gen X people in a country from the year 2010 to 2020 as well as the yearly fuel consumption of the country (in Million liters).

[Chart]

Considering the data presented in the chart, which one of the following options is true?

GATE 2024 EE GA question 8: Combined clustered-bar and line chart.Tap to open full size
Figure from the GATE 2024 EE paper. It is part of the question.
Figure description

Combined clustered-bar and line chart. Legend at top: blue bar = "Gen X", orange bar = "Millenials" (spelled this way in the legend), black line with x markers = "Fuel Consumption". Horizontal axis titled "Year" with three categories: 2010, 2015, 2020. Left vertical axis titled "Fuel Consumption (Million liters)", scale 0 to 100 in steps of 10. Right vertical axis titled "Number of people buying cars", scale 0 to 100000 in steps of 10000. Dashed horizontal gridlines at every step. Bars read on the right axis: 2010 - Gen X 40000, Millennials 20000; 2015 - Gen X 30000, Millennials 45000; 2020 - Gen X 25000, Millennials 60000. Fuel consumption line read on the left axis: 2010 = 50, 2015 = 60, 2020 = 90 (Million liters), drawn as straight segments from 50 to 60 to 90.

  1. (A)

    The percentage increase in fuel consumption from 2010 to 2015 is more than the percentage increase in fuel consumption from 2015 to 2020.

  2. (B)

    The increase in the number of Millennial car buyers from 2015 to 2020 is less than the decrease in the number of Gen X car buyers from 2010 to 2015.

  3. (C)

    The increase in the number of Millennial car buyers from 2010 to 2015 is more than the decrease in the number of Gen X car buyers from 2010 to 2015.

  4. (D)

    The decrease in the number of Gen X car buyers from 2015 to 2020 is more than the increase in the number of Millennial car buyers from 2010 to 2015.

Answer and solution
GATE 2024 EE GA Q.8: answer and solution

GATE 2024 IN GA Q.8

GATE 2024 · INGA Q.8 · 2 marks · MCQ

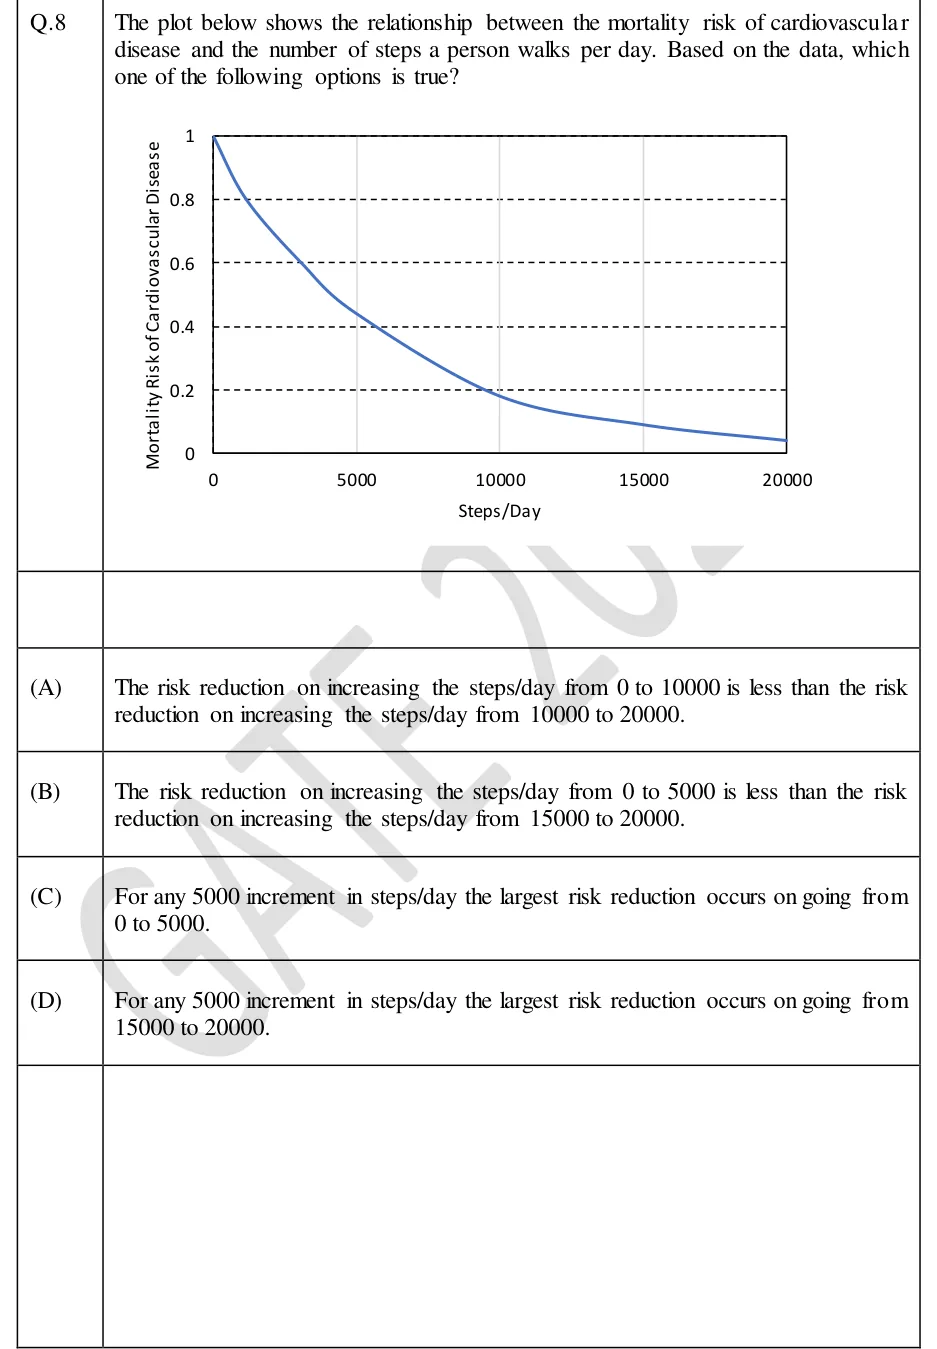
The plot below shows the relationship between the mortality risk of cardiovascular disease and the number of steps a person walks per day. Based on the data, which one of the following options is true?

GATE 2024 IN GA question 8: A single-curve line graph inside a rectangular plot frame.Tap to open full size
Figure from the GATE 2024 IN paper. It is part of the question.
Figure description

A single-curve line graph inside a rectangular plot frame. Horizontal axis labelled "Steps/Day", from 0 to 20000, ticks and labels at 0, 5000, 10000, 15000, 20000, with thin light-grey vertical gridlines at 5000, 10000 and 15000. Vertical axis labelled "Mortality Risk of Cardiovascular Disease", from 0 to 1, labels 0, 0.2, 0.4, 0.6, 0.8, 1, with dashed horizontal gridlines at 0.2, 0.4, 0.6 and 0.8. No title and no legend. One smooth blue curve that decreases the whole way and is convex (it drops steeply at first, then flattens). Approximate values read from the curve: 1.0 at 0 steps; crosses 0.8 near 1200 steps; crosses 0.6 near 3000 steps; about 0.45 at 5000 steps; crosses 0.4 near 5800 steps; crosses 0.2 near 9500 steps; about 0.18 at 10000 steps; about 0.10 at 15000 steps; about 0.04 at 20000 steps.

  1. (A)

    The risk reduction on increasing the steps/day from 0 to 10000 is less than the risk reduction on increasing the steps/day from 10000 to 20000.

  2. (B)

    The risk reduction on increasing the steps/day from 0 to 5000 is less than the risk reduction on increasing the steps/day from 15000 to 20000.

  3. (C)

    For any 5000 increment in steps/day the largest risk reduction occurs on going from 0 to 5000.

  4. (D)

    For any 5000 increment in steps/day the largest risk reduction occurs on going from 15000 to 20000.

Answer and solution
GATE 2024 IN GA Q.8: answer and solution

GATE 2020 EC GA Q.10

GATE 2020 · ECGA Q.10 · 2 marks · MCQ

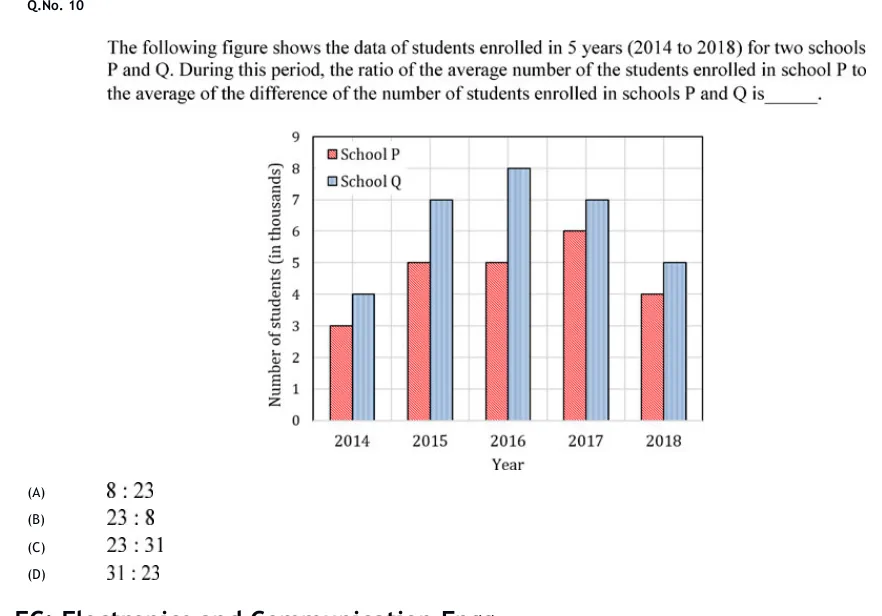
The following figure shows the data of students enrolled in 5 years (2014 to 2018) for two schools P and Q. During this period, the ratio of the average number of the students enrolled in school P to the average of the difference of the number of students enrolled in schools P and Q is______.

GATE 2020 EC GA question 10: A clustered vertical bar chart.Tap to open full size
Figure from the GATE 2020 EC paper. It is part of the question.
Figure description

A clustered vertical bar chart. Horizontal axis titled "Year" with five categories: 2014, 2015, 2016, 2017, 2018. Vertical axis titled "Number of students (in thousands)", from 0 to 9 with gridlines at every integer. Legend in the upper left inside the plot area: "School P" (red/pink bar, hatched) and "School Q" (light blue bar, hatched). In each year the School P bar is on the left and the School Q bar on the right. Values (in thousands): 2014 — P = 3, Q = 4; 2015 — P = 5, Q = 7; 2016 — P = 5, Q = 8; 2017 — P = 6, Q = 7; 2018 — P = 4, Q = 5.

  1. (A)

    8 : 23

  2. (B)

    23 : 8

  3. (C)

    23 : 31

  4. (D)

    31 : 23

Answer and solution
GATE 2020 EC GA Q.10: answer and solution

GATE 2020 EE GA Q.10

GATE 2020 · EEGA Q.10 · 2 marks · MCQ

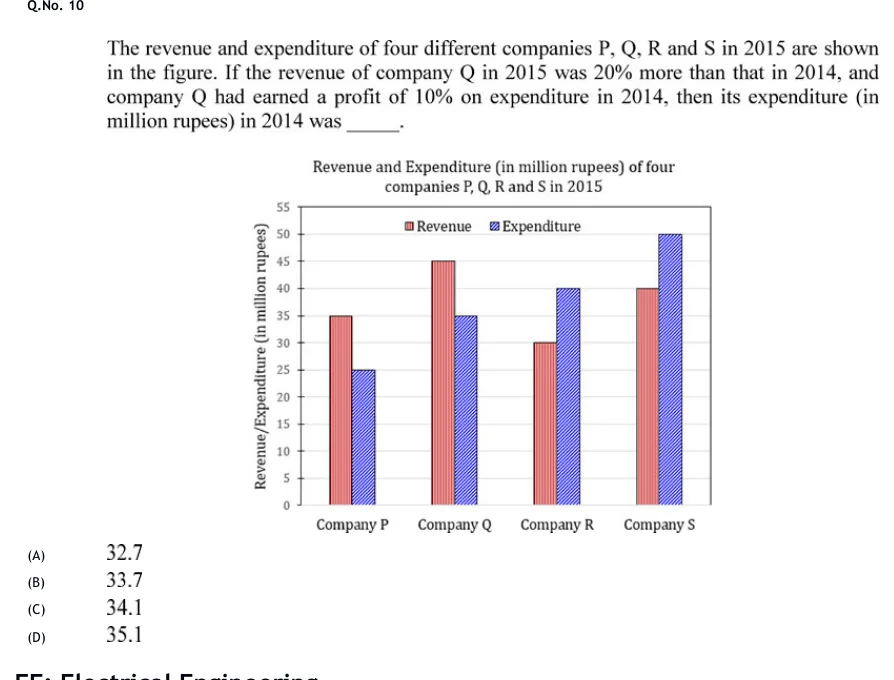
The revenue and expenditure of four different companies P, Q, R and S in 2015 are shown in the figure. If the revenue of company Q in 2015 was 20% more than that in 2014, and company Q had earned a profit of 10% on expenditure in 2014, then its expenditure (in million rupees) in 2014 was ______.

GATE 2020 EE GA question 10: Clustered vertical bar chart titled "Revenue and Expenditure (in million rupees) of four companies P, Q, R and S in…Tap to open full size
Figure from the GATE 2020 EE paper. It is part of the question.
Figure description

Clustered vertical bar chart titled "Revenue and Expenditure (in million rupees) of four companies P, Q, R and S in 2015". Vertical axis labelled "Revenue/Expenditure (in million rupees)", scale 0 to 55 in steps of 5 (ticks at 0, 5, 10, 15, 20, 25, 30, 35, 40, 45, 50, 55). Horizontal axis has four groups: Company P, Company Q, Company R, Company S. Legend at the top inside the plot: Revenue (red bar with vertical hatching, left bar of each pair) and Expenditure (blue bar with diagonal hatching, right bar of each pair). Data values: Company P - Revenue 35, Expenditure 25; Company Q - Revenue 45, Expenditure 35; Company R - Revenue 30, Expenditure 40; Company S - Revenue 40, Expenditure 50.

  1. (A)

    32.7

  2. (B)

    33.7

  3. (C)

    34.1

  4. (D)

    35.1

Answer and solution
GATE 2020 EE GA Q.10: answer and solution

GATE 2020 IN GA Q.10

GATE 2020 · INGA Q.10 · 2 marks · MCQ

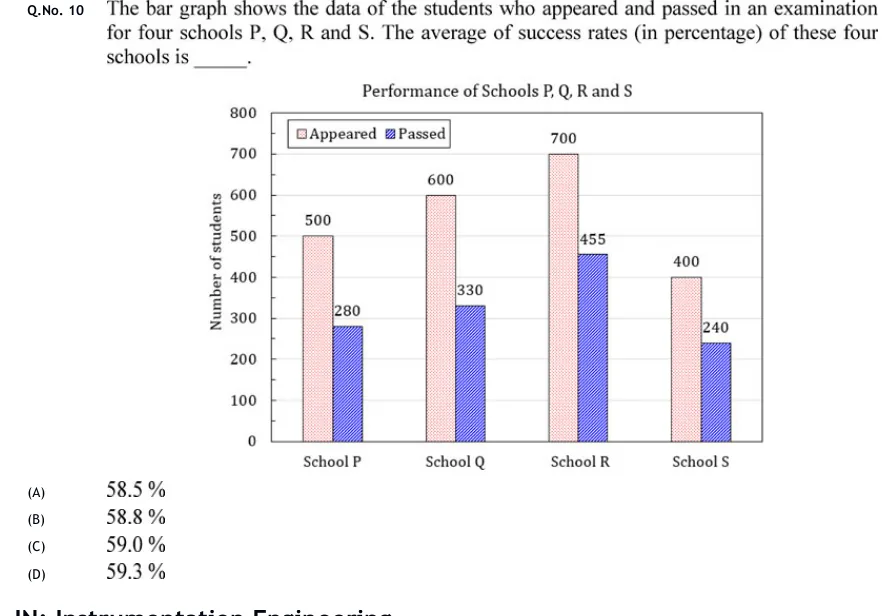
The bar graph shows the data of the students who appeared and passed in an examination for four schools P, Q, R and S. The average of success rates (in percentage) of these four schools is ______.

GATE 2020 IN GA question 10: Grouped (clustered) vertical bar chart titled "Performance of Schools P, Q, R and S".Tap to open full size
Figure from the GATE 2020 IN paper. It is part of the question.
Figure description

Grouped (clustered) vertical bar chart titled "Performance of Schools P, Q, R and S". Vertical axis labelled "Number of students", scale 0 to 800 in steps of 100, with light horizontal gridlines. Horizontal axis has four categories, left to right: School P, School Q, School R, School S. Legend at top left inside the plot: "Appeared" (light pink, finely dotted fill) and "Passed" (blue, diagonally hatched fill). Each school has two adjacent bars, Appeared on the left and Passed on the right, each with its value printed above or at the top of the bar. School P: Appeared 500, Passed 280. School Q: Appeared 600, Passed 330. School R: Appeared 700, Passed 455. School S: Appeared 400, Passed 240.

  1. (A)

    58.5 %

  2. (B)

    58.8 %

  3. (C)

    59.0 %

  4. (D)

    59.3 %

Answer and solution
GATE 2020 IN GA Q.10: answer and solution

GATE 2018 IN GA Q.10

GATE 2018 · INGA Q.10 · 2 marks · MCQ

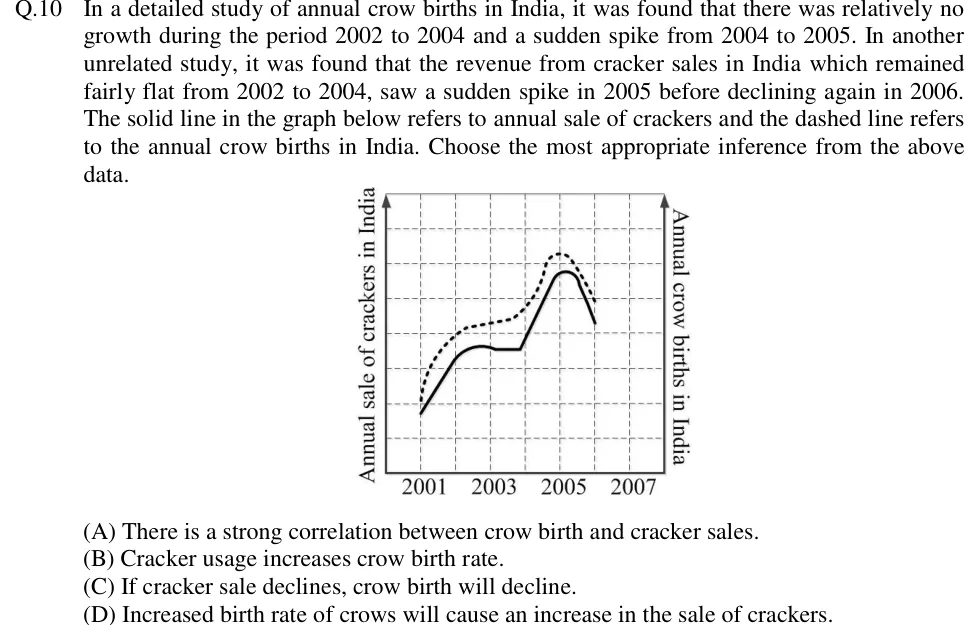
In a detailed study of annual crow births in India, it was found that there was relatively no growth during the period 2002 to 2004 and a sudden spike from 2004 to 2005. In another unrelated study, it was found that the revenue from cracker sales in India which remained fairly flat from 2002 to 2004, saw a sudden spike in 2005 before declining again in 2006. The solid line in the graph below refers to annual sale of crackers and the dashed line refers to the annual crow births in India. Choose the most appropriate inference from the above data.

GATE 2018 IN GA question 10: A line graph on a dashed square grid.Tap to open full size
Figure from the GATE 2018 IN paper. It is part of the question.
Figure description

A line graph on a dashed square grid. The horizontal axis is marked 2001, 2003, 2005, 2007 below it, with one vertical grid line per year (2001 to 2007). The left vertical axis (arrow pointing up) is labelled 'Annual sale of crackers in India'. The right vertical axis (arrow pointing up) is labelled 'Annual crow births in India'. Neither vertical axis has numbers on it. The SOLID line (cracker sales) starts low at 2001 and rises in a straight line to 2002. It keeps rising a little into a slight hump between 2002 and 2003, then runs flat until just before 2004. It then climbs steeply to a peak just after 2005 and falls sharply to 2006, where it ends. The DASHED line (crow births) lies above the solid line the whole way. It starts at 2001 slightly above the solid line's start, rises steeply to about 2002, creeps up only slightly from 2002 to 2004, climbs steeply to a peak at about 2005 (higher than the solid peak) and falls to 2006, where it ends. The two curves rise, level off, peak and fall in the same years.

  1. (A)

    There is a strong correlation between crow birth and cracker sales.

  2. (B)

    Cracker usage increases crow birth rate.

  3. (C)

    If cracker sale declines, crow birth will decline.

  4. (D)

    Increased birth rate of crows will cause an increase in the sale of crackers.

Answer and solution
GATE 2018 IN GA Q.10: answer and solution

PRACTICE

5 questions to test yourself

PRACTICE 11 mark · MCQ

A map is drawn to a scale of . A rectangular park measures 3 cm by 2 cm on the map. What is the area of the park on the ground?

  1. (A)

    0.24 km²

  2. (B)

    0.96 km²

  3. (C)

    2.4 km²

  4. (D)

    9.6 km²

Answer and solution

Answer: (B)

  1. At , 1 cm on the map is 40,000 cm m km on the ground.

  2. The sides on the ground are km and km.

  3. Area km². Equivalently, 6 cm² km².

  4. Option (C) comes from multiplying the map area by the linear scale once instead of by its square.

PRACTICE 22 marks · NAT

Two pie charts show how a company's total expenditure was divided among its departments. In 2024 the total expenditure was Rs. 80 lakh and the sector for Research had a central angle of . In 2025 the total expenditure was Rs. 105 lakh and the sector for Research had a central angle of .

The percentage increase in the company's expenditure on Research from 2024 to 2025 is ________ (rounded off to one decimal place).

Answer and solution

Answer: (accepted range )

  1. Research in 2024 lakh.

  2. Research in 2025 lakh.

  3. Percentage increase , which is 51.7 to one decimal place.

  4. Comparing the angles alone ( to , about 15.6%) is wrong, because the two pies have different totals.

PRACTICE 32 marks · MSQ

The annual production of a factory, in thousand units, was:

  • 2020: 40
  • 2021: 50
  • 2022: 55
  • 2023: 66
  • 2024: 72.6

Which of the following statements is/are CORRECT?

  1. (A)

    The largest percentage increase over the previous year occurred in 2021.

  2. (B)

    The largest absolute increase over the previous year occurred in 2021.

  3. (C)

    The compound annual growth rate of production from 2020 to 2024 is less than 16.25%.

  4. (D)

    The percentage increase in production from 2020 to 2024 equals the sum of the four year-on-year percentage increases.

Answer and solution

Answer: (A), (C)

  1. Year-on-year changes: 2021: (25%); 2022: (10%); 2023: (20%); 2024: (10%).

  2. (A) Correct: 25% in 2021 is the largest percentage increase.

  3. (B) Incorrect: the largest absolute increase is 11 thousand units, in 2023.

  4. (C) Correct: , so over periods the CAGR is . This is below the arithmetic mean of the four rates, , as it must be when the yearly rates are not all equal.

  5. (D) Incorrect: the overall increase is , while the sum of the four rates is . With all rates positive, compounding makes the overall rise larger than the sum.

PRACTICE 41 mark · NAT

In one week a shop sold 120 pens at Rs. 10 each, 50 pens at Rs. 25 each and 30 pens at Rs. 40 each. The average selling price per pen for the week, in Rs., is ________ (rounded off to two decimal places).

Answer and solution

Answer: (accepted range )

  1. Total revenue rupees.

  2. Total pens sold .

  3. Average price rupees per pen: a weighted mean with weights 120, 50 and 30.

  4. The plain mean of the three prices, , ignores how many pens of each kind were sold.

PRACTICE 52 marks · MCQ

A stacked bar graph shows the sales of three products X, Y and Z, in thousand units, in two years. In each bar X is at the bottom, Y in the middle and Z on top. The value-axis readings at the upper edge of each segment are:

  • Year 1: X up to 30, Y up to 75, Z up to 100
  • Year 2: X up to 42, Y up to 90, Z up to 125

Which one of the following statements is CORRECT?

  1. (A)

    Sales of Y rose by 20% from Year 1 to Year 2.

  2. (B)

    The share of Y in total sales fell by 6.6 percentage points from Year 1 to Year 2.

  3. (C)

    The share of Y in total sales fell by 6.6% of its Year 1 value from Year 1 to Year 2.

  4. (D)

    Sales of Z rose by 25% from Year 1 to Year 2.

Answer and solution

Answer: (B)

  1. Each segment is its upper-edge reading minus the reading below it. Year 1: X , Y , Z , total 100. Year 2: X , Y , Z , total 125.

  2. (A) Incorrect: sales of Y rose from 45 to 48, i.e. by . The 20% comes from wrongly using Y's upper edges, 75 and 90.

  3. (B) Correct: Y's share was in Year 1 and in Year 2, a fall of percentage points.

  4. (C) Incorrect: the relative fall in the share is , not 6.6%.

  5. (D) Incorrect: sales of Z rose from 25 to 35, i.e. by 40%. The 25% is the rise in total sales.

OFFICIAL GATE 2027 SYLLABUS WORDING

Copied from the GATE 2027 syllabus; see all 2027 syllabi.

EVERY GATE PAPER

Data interpretation: data graphs (bar graphs, pie charts, and other graphs representing data), 2-and 3-dimensional plots, maps, and tables

Preparing in Kolkata? See IAE Academy’s GATE courses.