
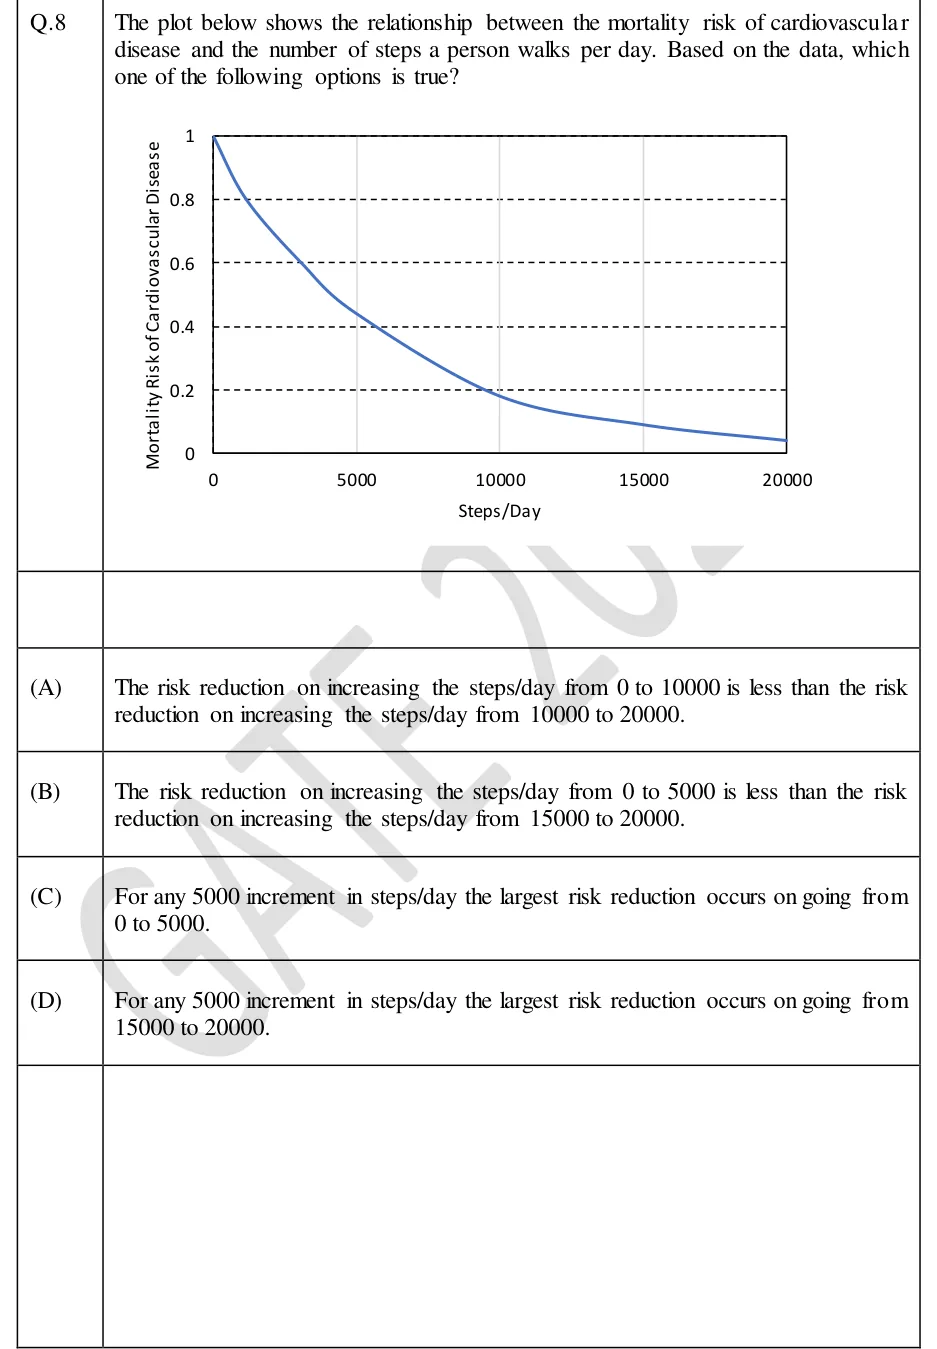
The plot below shows the relationship between the mortality risk of cardiovascular disease and the number of steps a person walks per day. Based on the data, which one of the following options is true?
 Tap to open full size
Figure description
A single-curve line graph inside a rectangular plot frame. Horizontal axis labelled "Steps/Day", from 0 to 20000, ticks and labels at 0, 5000, 10000, 15000, 20000, with thin light-grey vertical gridlines at 5000, 10000 and 15000. Vertical axis labelled "Mortality Risk of Cardiovascular Disease", from 0 to 1, labels 0, 0.2, 0.4, 0.6, 0.8, 1, with dashed horizontal gridlines at 0.2, 0.4, 0.6 and 0.8. No title and no legend. One smooth blue curve that decreases the whole way and is convex (it drops steeply at first, then flattens). Approximate values read from the curve: 1.0 at 0 steps; crosses 0.8 near 1200 steps; crosses 0.6 near 3000 steps; about 0.45 at 5000 steps; crosses 0.4 near 5800 steps; crosses 0.2 near 9500 steps; about 0.18 at 10000 steps; about 0.10 at 15000 steps; about 0.04 at 20000 steps.
- (A)
The risk reduction on increasing the steps/day from 0 to 10000 is less than the risk reduction on increasing the steps/day from 10000 to 20000.
- (B)
The risk reduction on increasing the steps/day from 0 to 5000 is less than the risk reduction on increasing the steps/day from 15000 to 20000.
- (C)
For any 5000 increment in steps/day the largest risk reduction occurs on going from 0 to 5000.
- (D)
For any 5000 increment in steps/day the largest risk reduction occurs on going from 15000 to 20000.