
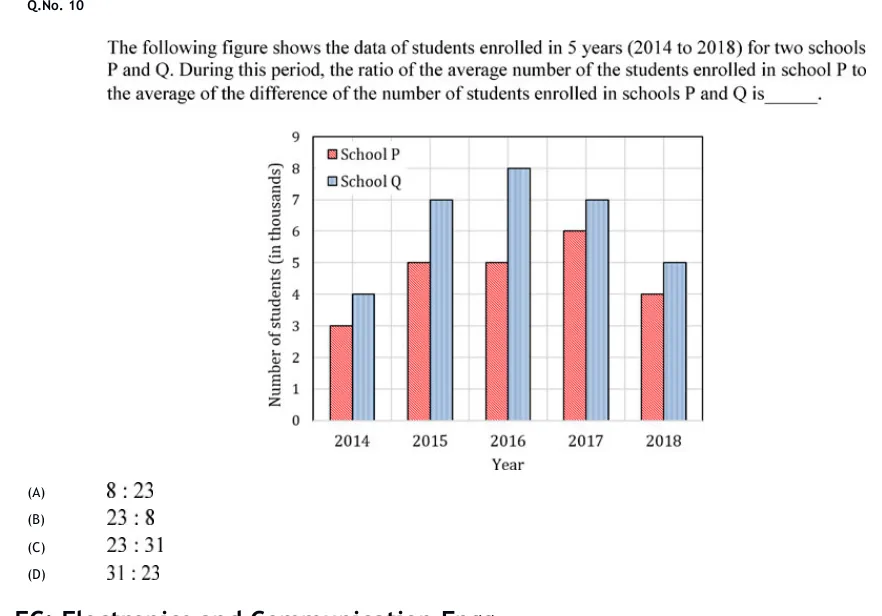
The following figure shows the data of students enrolled in 5 years (2014 to 2018) for two schools P and Q. During this period, the ratio of the average number of the students enrolled in school P to the average of the difference of the number of students enrolled in schools P and Q is______.
 Tap to open full size
Figure description
A clustered vertical bar chart. Horizontal axis titled "Year" with five categories: 2014, 2015, 2016, 2017, 2018. Vertical axis titled "Number of students (in thousands)", from 0 to 9 with gridlines at every integer. Legend in the upper left inside the plot area: "School P" (red/pink bar, hatched) and "School Q" (light blue bar, hatched). In each year the School P bar is on the left and the School Q bar on the right. Values (in thousands): 2014 — P = 3, Q = 4; 2015 — P = 5, Q = 7; 2016 — P = 5, Q = 8; 2017 — P = 6, Q = 7; 2018 — P = 4, Q = 5.
- (A)
8 : 23
- (B)
23 : 8
- (C)
23 : 31
- (D)
31 : 23