
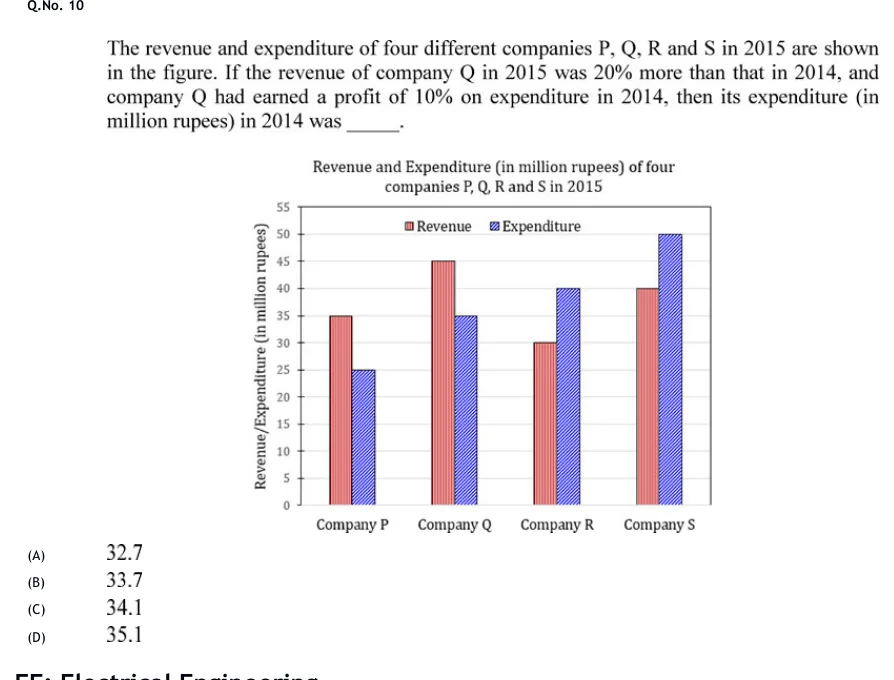
The revenue and expenditure of four different companies P, Q, R and S in 2015 are shown in the figure. If the revenue of company Q in 2015 was 20% more than that in 2014, and company Q had earned a profit of 10% on expenditure in 2014, then its expenditure (in million rupees) in 2014 was ______.
 Tap to open full size
Figure description
Clustered vertical bar chart titled "Revenue and Expenditure (in million rupees) of four companies P, Q, R and S in 2015". Vertical axis labelled "Revenue/Expenditure (in million rupees)", scale 0 to 55 in steps of 5 (ticks at 0, 5, 10, 15, 20, 25, 30, 35, 40, 45, 50, 55). Horizontal axis has four groups: Company P, Company Q, Company R, Company S. Legend at the top inside the plot: Revenue (red bar with vertical hatching, left bar of each pair) and Expenditure (blue bar with diagonal hatching, right bar of each pair). Data values: Company P - Revenue 35, Expenditure 25; Company Q - Revenue 45, Expenditure 35; Company R - Revenue 30, Expenditure 40; Company S - Revenue 40, Expenditure 50.
- (A)
32.7
- (B)
33.7
- (C)
34.1
- (D)
35.1