
For non-degenerately doped n-type silicon, which one of the following plots represents the temperature () dependence of free electron concentration ()?
 Tap to open full size
Figure description
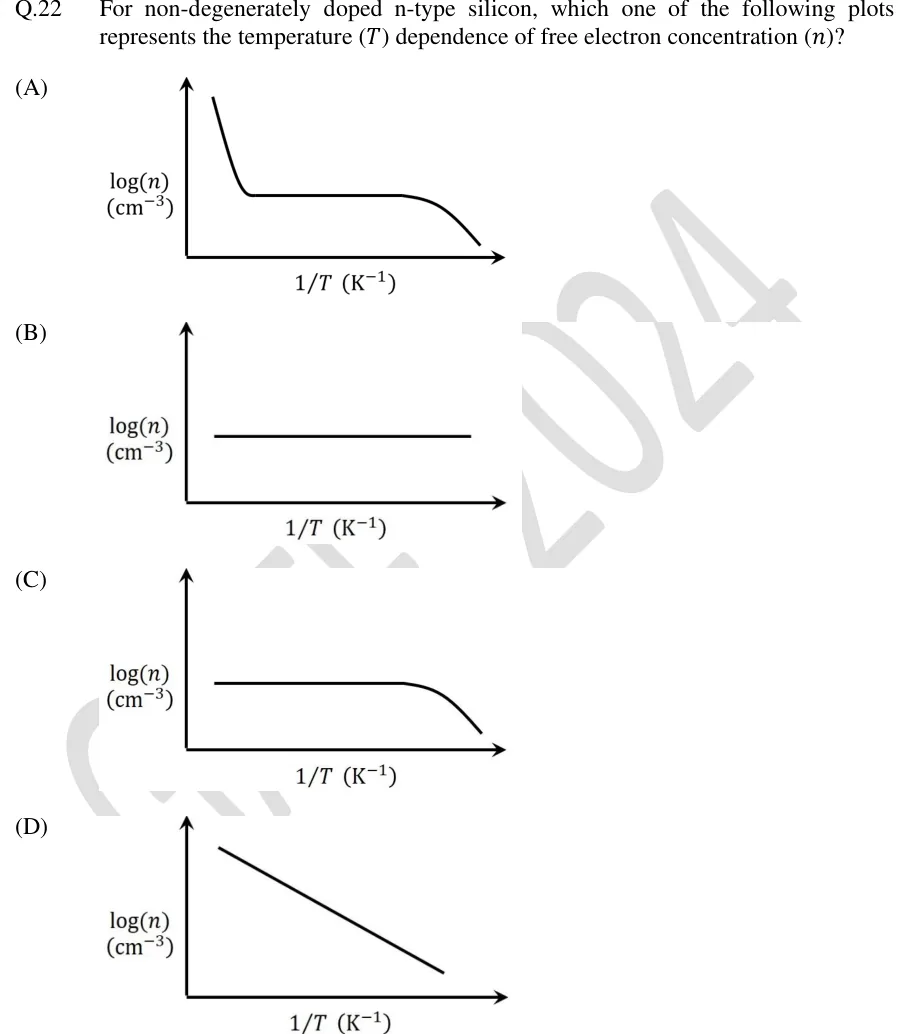
Four small plots, each with axes log (n) (cm^-3) on the vertical axis and 1/T (K^-1) on the horizontal axis (increasing rightward, so low 1/T = high T is on the left and high 1/T = low T is on the right). (A): curve starts high near the top-left, drops steeply, levels into a flat horizontal plateau across the middle, then drops steeply again near the right end (three regions: intrinsic decrease, extrinsic plateau, freeze-out decrease). (B): a single flat horizontal line segment across the middle of the plot (constant log (n), no rise or fall shown). (C): a flat horizontal plateau starting from the left that curves downward only near the right end (plateau plus one drop, no left-side intrinsic decrease). (D): a single straight line with constant negative slope running from upper-left to lower-right (monotonic decrease, no plateau).
- (A)
Figure — plot showing (left to right): a decreasing curve from high , then a flat plateau, then another decreasing curve near the right end (three-region S-shaped curve)
- (B)
Figure — plot showing a single flat horizontal line (constant across the whole range)
- (C)
Figure — plot showing a flat plateau on the left that bends downward only near the right end (two-region curve, no intrinsic rise on the left)
- (D)
Figure — plot showing a single straight line with constant negative slope from upper-left to lower-right (simple monotonic decrease)