
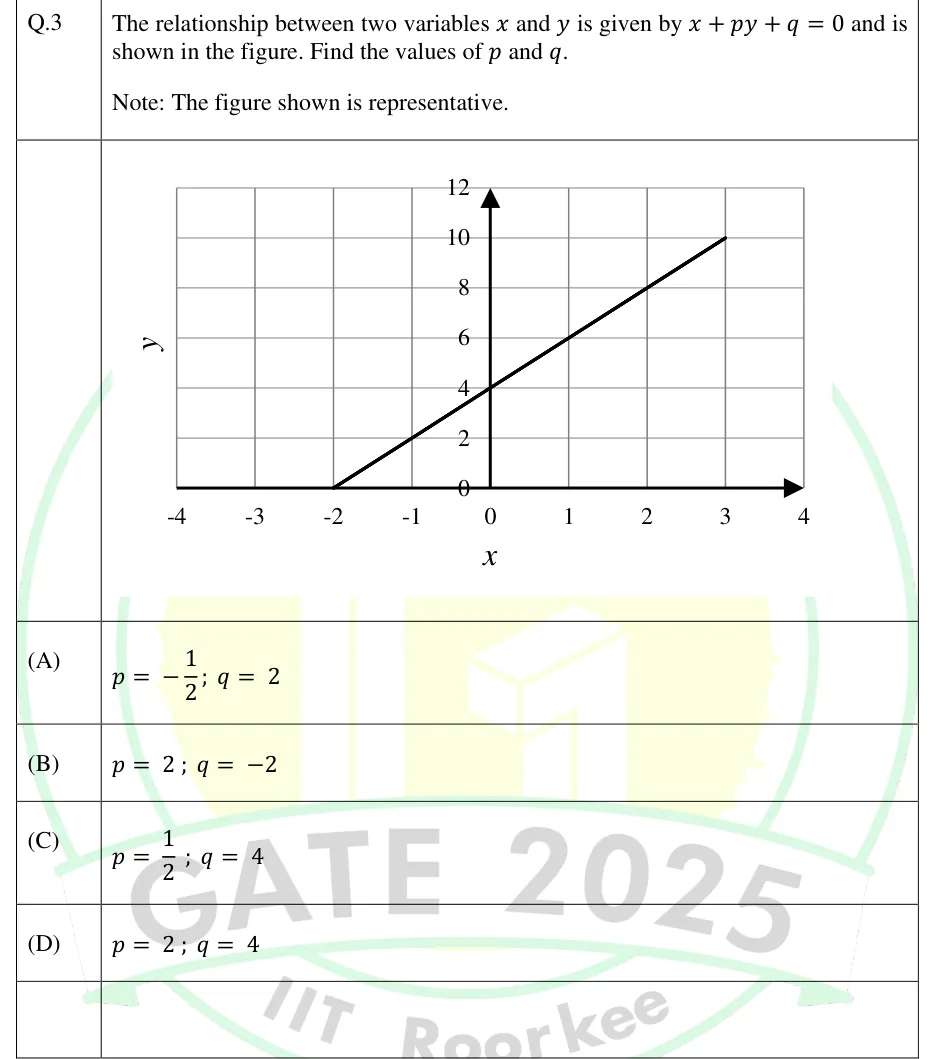
The relationship between two variables and is given by and is shown in the figure. Find the values of and .
Note: The figure shown is representative.
 Tap to open full size
Figure description
A Cartesian graph on a square grid. Horizontal axis labelled x, with tick labels -4, -3, -2, -1, 0, 1, 2, 3, 4 (one grid column per unit); the x-axis is drawn as a thick line from x=-4 to x=4 with an arrowhead at the right end. Vertical axis labelled y (label placed at the left of the grid), drawn as a thick line at x=0 from y=0 up to y=12 with an arrowhead at the top; tick labels 0, 2, 4, 6, 8, 10, 12 printed just left of the y-axis (one grid row per 2 units). Horizontal grid lines at y = 0, 2, 4, 6, 8, 10, 12; vertical grid lines at x = -4, -3,, 4. A single straight thick line segment starts on the x-axis at (-2, 0), rises to the right, crosses the y-axis at (0, 4), passes through (1, 6) and (2, 8), and ends at (3, 10).
- (A)
- (B)
- (C)
- (D)