
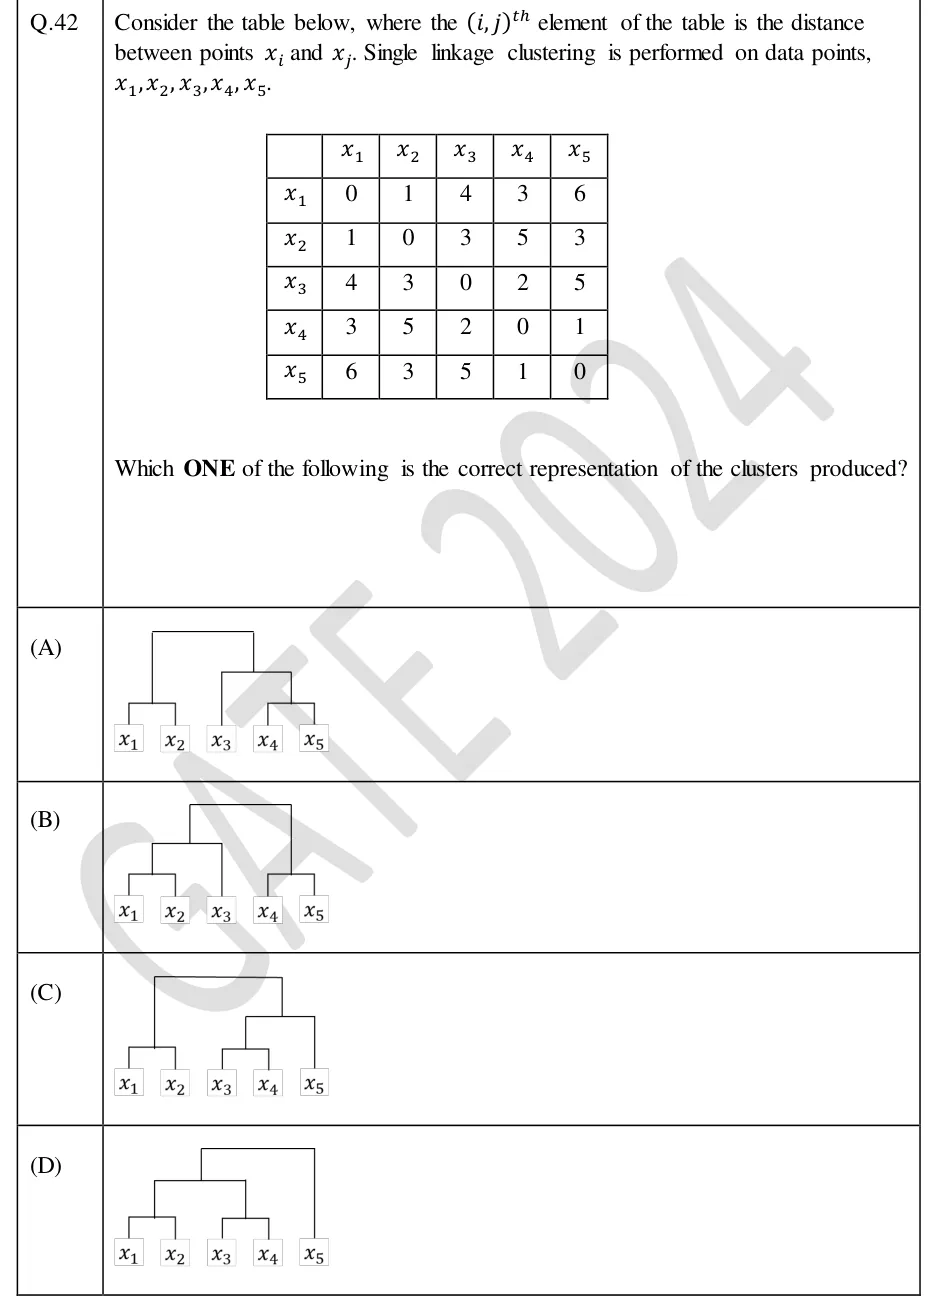
Consider the table below, where the element of the table is the distance between points and . Single linkage clustering is performed on data points, .
| | | | | | |
|---|---|---|---|---|---|
| | 0 | 1 | 4 | 3 | 6 |
| | 1 | 0 | 3 | 5 | 3 |
| | 4 | 3 | 0 | 2 | 5 |
| | 3 | 5 | 2 | 0 | 1 |
| | 6 | 3 | 5 | 1 | 0 |
Which ONE of the following is the correct representation of the clusters produced?
 Tap to open full size
Figure description
A 5x5 symmetric distance table (given in the stem) and four dendrograms (A to D), each with leaves in the order x1, x2, x3, x4, x5.
- (A)
Figure: dendrogram in which x1 and x2 join as a pair; x4 and x5 join as a pair, and x3 then joins {x4,x5}; the two groups join at the top.
- (B)
Figure: dendrogram in which x1 and x2 join, then x3 joins {x1,x2}; x4 and x5 join as a separate pair; the two groups join at the top.
- (C)
Figure: dendrogram in which x1 and x2 join; x3 and x4 join, then x5 joins {x3,x4}; the two groups join at the top.
- (D)
Figure: dendrogram in which x1 and x2 join; x3 and x4 join; these two pairs merge; x5 joins last at the top.