
IAE Academy

GATE 2018 IN Q.20: solution and answer

GATE 2018 · INQ.20 · 1 mark · MCQ

A voltage of V is fed as y-input to a CRO. The waveform seen on the screen of the CRO is shown in the figure. The Y and X axes settings for the CRO are respectively
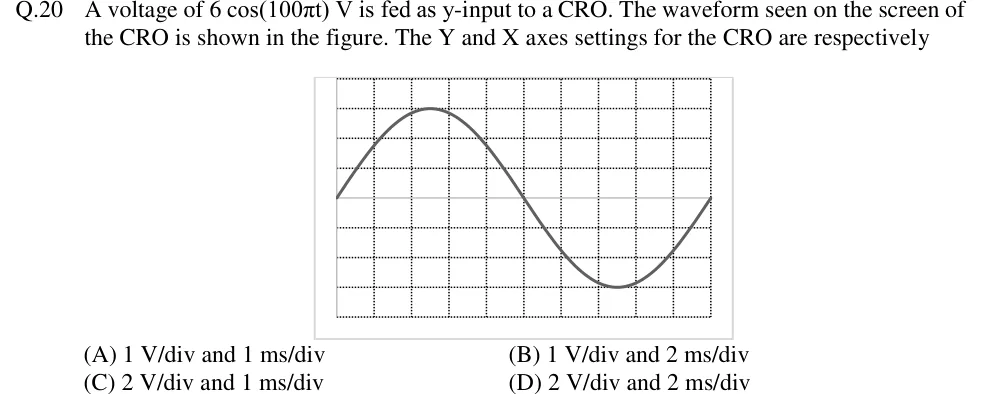
GATE 2018 IN question 20: CRO screen graticule with 10 horizontal divisions and 8 vertical divisions (dotted grid lines), the horizontal centre line…Tap to open full size
Figure from the GATE 2018 IN paper. It is part of the question.
Figure description

CRO screen graticule with 10 horizontal divisions and 8 vertical divisions (dotted grid lines), the horizontal centre line at 4 divisions from the top/bottom. One sinusoid is displayed: it starts at the left edge on the centre line going upward, reaches its positive peak 3 divisions above the centre line at about 2.5 divisions from the left, crosses the centre line going downward at the 5th vertical division (screen middle), reaches its negative peak 3 divisions below the centre line at about 7.5 divisions, and returns to the centre line at the right edge (10th division). So exactly one full cycle fills the 10 horizontal divisions and the peak-to-peak height is 6 divisions.

  1. (A)

    1 V/div and 1 ms/div

  2. (B)

    1 V/div and 2 ms/div

  3. (C)

    2 V/div and 1 ms/div

  4. (D)

    2 V/div and 2 ms/div

Answer and solution

ANSWER

(D) 2 V/div and 2 ms/div. The 6 V peak covers 3 vertical divisions, giving 2 V/div. One 20 ms period (50 Hz) covers 10 horizontal divisions, giving 2 ms/div.

Official answer: DSource: Official answer key, GATE 2018 IN (IIT Guwahati)

  1. Read the signal: , so the peak value is and the angular frequency is .

  2. Frequency and period from : , so .

  3. Read the screen vertically: the positive peak is 3 divisions above the centre line and the negative peak is 3 divisions below it, so the amplitude spans 3 vertical divisions (6 divisions peak-to-peak).

  4. Vertical sensitivity = volts per division: . Check with peak-to-peak values: .

  5. Read the screen horizontally: the trace goes from the centre line up to the peak, down through the centre line at the middle of the screen, down to the trough and back to the centre line at the right edge. That is exactly one complete cycle across all 10 horizontal divisions.

  6. Time base = time per division: .

  7. The trace starts at a zero crossing, not at a peak, only because of where the sweep is triggered. The trigger point sets the starting phase on screen but does not change the amplitude or the period. So the settings are and , which is option (D).

KEY IDEA

On a CRO, volts per division = voltage ÷ vertical divisions it covers, and time per division = time ÷ horizontal divisions it covers. Take the peak (or peak-to-peak) voltage and the period from the signal, count their divisions on the graticule, and divide.

WATCH OUT FOR

Three common slips. (1) Dividing the peak voltage by the peak-to-peak height: gives the wrong answer of 1 V/div. (2) Taking as the frequency in hertz, or using (, which gives 1 ms/div), when in fact gives . (3) Thinking that because the input is a cosine, the trace cannot start at a zero crossing. Where the trace starts depends only on the trigger point.

From the GATE 2018 IN paper. Every question of this paper · Download the full paper · All 5 Time, frequency & scopes questions, with notes

More Time, frequency & scopes questions