
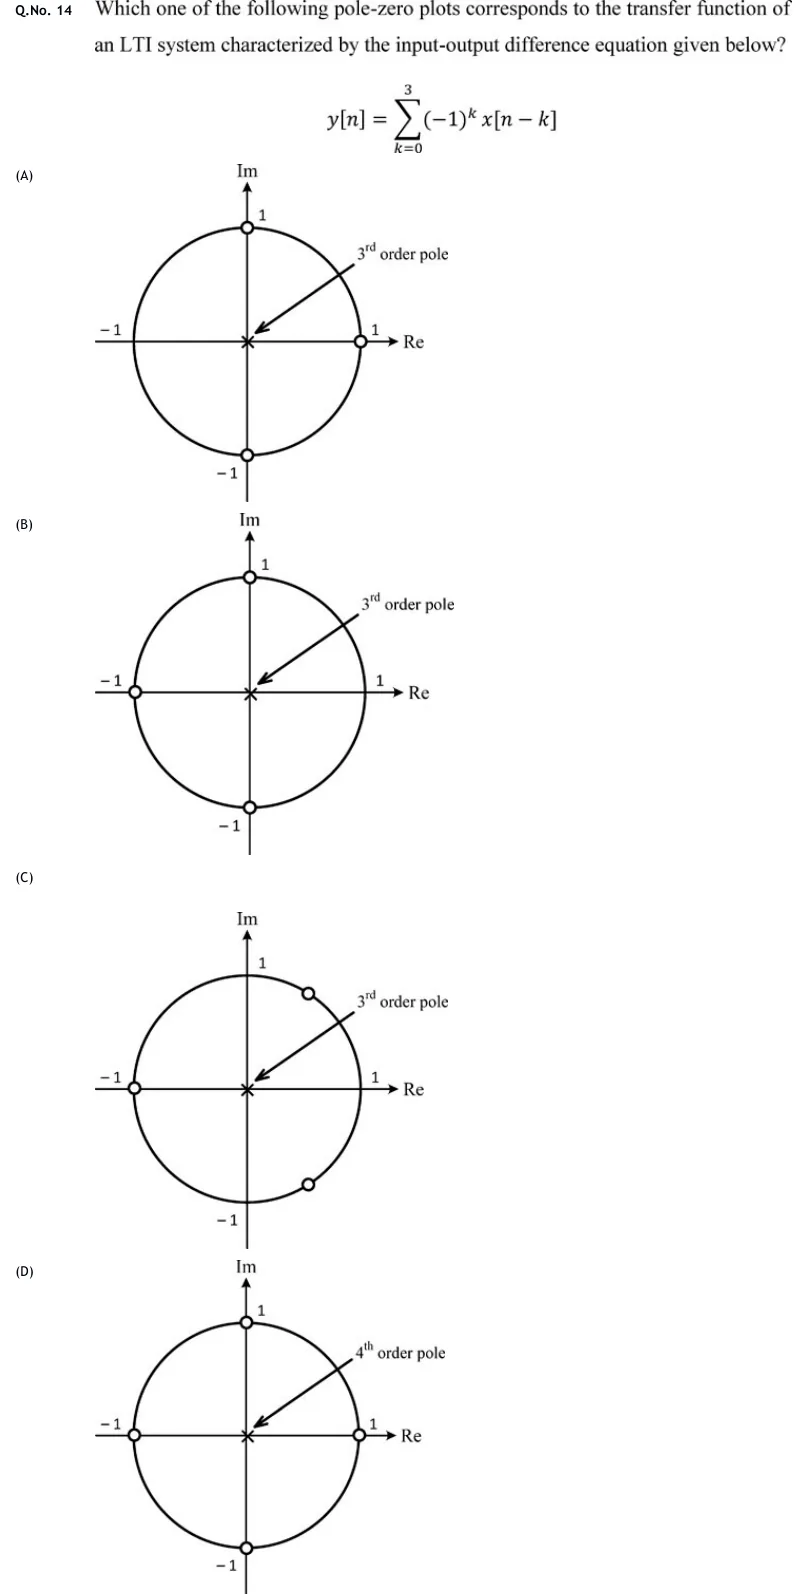
Which one of the following pole-zero plots corresponds to the transfer function of an LTI system characterized by the input-output difference equation given below?
 Tap to open full size
Figure description
Each option is a z-plane pole-zero plot: horizontal axis Re, vertical axis Im, with the unit circle drawn and the points 1, -1 marked on the Re axis and 1, -1 on the Im axis. Zeros are drawn as small open circles on the unit circle. A cross at the origin marks a multiple pole, labelled with an arrow.
- (A)
Figure — zeros (o) at , and on the unit circle; a cross at the origin labelled "3rd order pole".
- (B)
Figure — zeros (o) at , and on the unit circle; a cross at the origin labelled "3rd order pole".
- (C)
Figure — zeros (o) at and at two conjugate points on the unit circle in the right half-plane, at about (i.e. ); a cross at the origin labelled "3rd order pole".
- (D)
Figure — zeros (o) at , , and on the unit circle; a cross at the origin labelled "4th order pole".