
IAE Academy

GATE 2023 EC Q.57: solution and answer

GATE 2023 · ECQ.57 · 2 marks · NAT

The asymptotic magnitude Bode plot of a minimum phase system is shown in the figure. The transfer function of the system is , where and are positive constants. The value of is ________ (rounded off to the nearest integer).
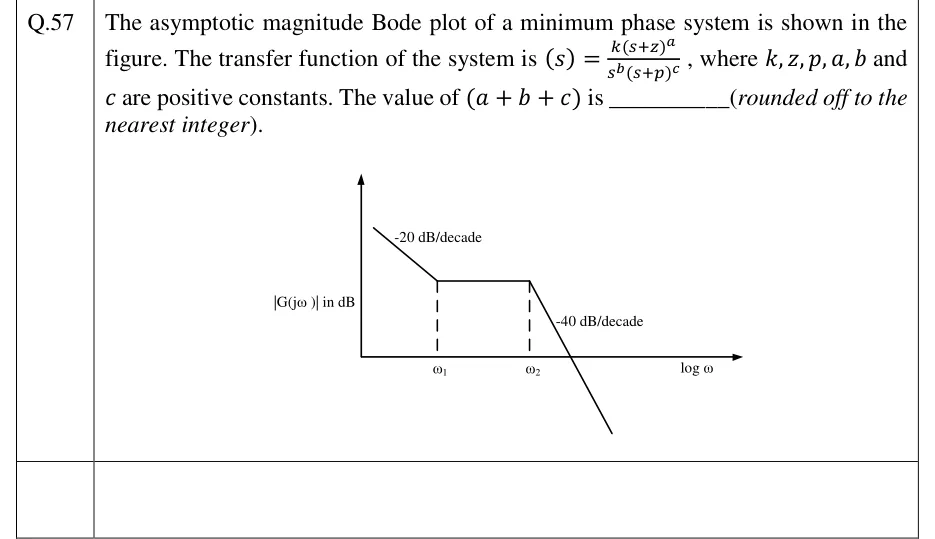
GATE 2023 EC question 57: Asymptotic Bode magnitude plot.Tap to open full size
Figure from the GATE 2023 EC paper. It is part of the question.
Figure description

Asymptotic Bode magnitude plot. Vertical axis labelled |G(jω)| in dB; horizontal axis labelled log ω. The plot starts at low frequency as a straight line falling with slope labelled -20 dB/decade until frequency ω1 (dashed vertical line to the axis). From ω1 to ω2 (second dashed vertical line) the plot is a horizontal line (0 dB/decade) at a positive dB level. After ω2 the plot falls steeply with slope labelled -40 dB/decade, crossing the log ω axis (0 dB) and continuing below it. No numerical values are given for ω1, ω2 or the dB levels.

Answer and solution

ANSWER

, with , and , so .

Official answer: 4Source: Official answer key, GATE 2023 EC (IIT Kanpur)

  1. Read the form of the transfer function. Each factor bends the asymptotic magnitude plot in its own way. in the denominator sets the starting slope at . adds above . adds above .

  2. The starting slope gives the number of poles at the origin. The plot starts at , so and .

  3. Corner at : the slope goes from to , a change of . A slope that rises comes from the zero factor. So and , which gives .

  4. Corner at : the slope goes from to , a change of . A slope that falls comes from the pole factor. So and , which gives . The given form has only one non-origin pole factor, so the drop has to be one repeated pole of order 2.

  5. Why the magnitude plot is enough. A magnitude plot cannot tell a left-half-plane zero from a right-half-plane zero. The system is stated to be minimum phase, though, and puts every zero and pole in the left half plane. That rules out the ambiguity, and the transfer function is

  6. Sum: .

KEY IDEA

In an asymptotic Bode magnitude plot, the starting slope is for each pole at the origin. After that, the slope rises by for each zero at its corner and falls by for each pole at its corner. So the power of each factor is the change in slope at its corner divided by 20. Minimum phase is what lets the magnitude plot fix the transfer function uniquely.

WATCH OUT FOR

Reading the final slope of as the change at and adding the origin pole again, which gives or . The change at is measured from the flat segment, so it is and . A second mistake is taking the flat segment to mean there is no zero. Going from to is a change, so there is one zero ().

From the GATE 2023 EC paper. Every question of this paper · Download the full paper · All 27 Bode & margins questions, with notes

More Bode & margins questions