
IAE Academy

GATE 2025 EC Q.16: solution and answer

GATE 2025 · ECQ.16 · 1 mark · MCQ

The Nyquist plot of a system is given in the figure below. Let , , , and be the positive frequencies at the points , , , and , respectively.

Which one of the following statements is TRUE?
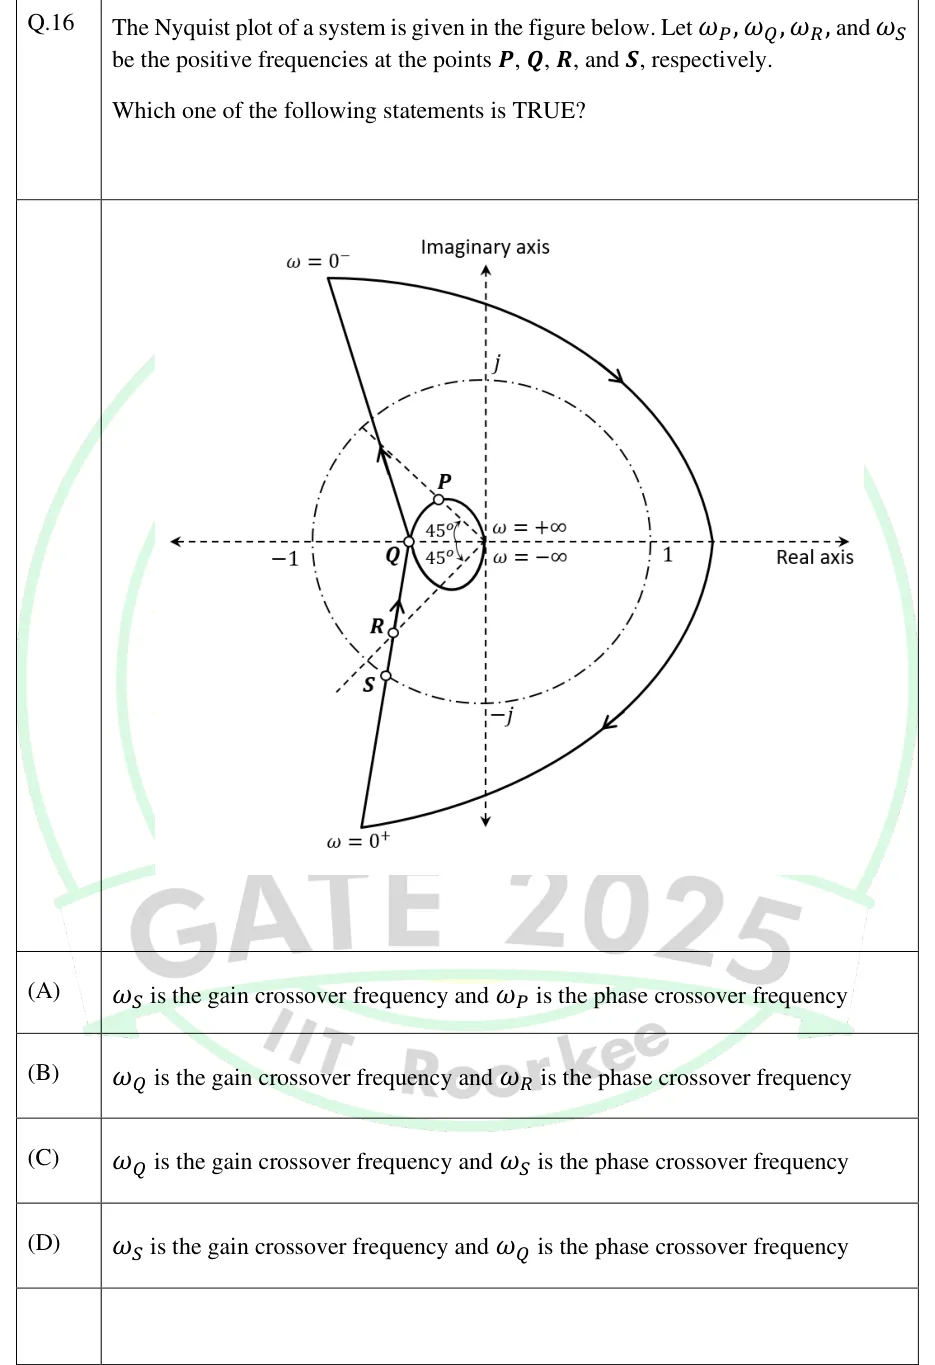
GATE 2025 EC question 16: Nyquist plot in the complex plane.Tap to open full size
Figure from the GATE 2025 EC paper. It is part of the question.
Figure description

Nyquist plot in the complex plane. The real axis (labelled 'Real axis') and the imaginary axis (labelled 'Imaginary axis') are dashed. A dash-dot unit circle centred at the origin passes through the labelled points -1, 1, j and -j. Two dashed rays leave the origin into the left half-plane, 45° above and 45° below the negative real axis (each angle marked 45°), i.e. along ∠ 135° and ∠ -135°. The point labelled ω = 0^- is at the top left (about -0.95 + j1.6) and ω = 0^+ is at the bottom left (about -0.75 - j1.75). A large arc on the right joins them clockwise (arrows pointing clockwise) and crosses the positive real axis at about +1.4. From ω = 0^+ a nearly straight branch rises (arrow pointing upward). It first passes through point S, where it crosses the unit circle. It then passes through point R, where it crosses the -135° ray inside the unit circle, and reaches point Q on the negative real axis at about -0.45. S is not on the ray: the -135° ray meets the unit circle at an unlabelled point a little up and to the left of S, so S sits at an angle of roughly -125°. From Q a small loop continues. Its upper half passes through point P, where the 135° ray crosses it inside the unit circle, and ends at the origin, labelled ω = + ∞. Its lower half runs from the origin (labelled ω = - ∞) back to Q. From Q a second nearly straight branch, drawn roughly as the mirror image of the lower one, goes up and to the left to ω = 0^- (arrow pointing upward, away from Q).

  1. (A)

    is the gain crossover frequency and is the phase crossover frequency

  2. (B)

    is the gain crossover frequency and is the phase crossover frequency

  3. (C)

    is the gain crossover frequency and is the phase crossover frequency

  4. (D)

    is the gain crossover frequency and is the phase crossover frequency

Answer and solution

ANSWER

(D): is the gain crossover frequency, because the locus crosses the unit circle at . is the phase crossover frequency, because the locus crosses the negative real axis at .

Official answer: DSource: Official answer key, GATE 2025 EC (IIT Roorkee)

  1. Definitions. The gain crossover frequency is where . On a Nyquist plot, that is where the positive-frequency locus crosses the unit circle. The phase crossover frequency is where , i.e. where the locus crosses the negative real axis.

  2. Find the positive-frequency branch. Follow the arrows from . The locus rises through , then , then , then goes round the upper half of the small loop through and ends at the origin at . The large arc on the right (from to ) and the branch from the origin () through the lower half of the loop and up to are not positive frequencies. Along the positive branch the phase keeps falling: about at , at , at and at .

  3. Point gives the gain crossover. lies on the dash-dot unit circle, so and . The positive branch meets the unit circle only once: it is outside the circle before and stays inside after it. So this is the only gain crossover. Note that is not on the ray. That ray crosses the locus at , so the phase at is not . It is less lagging, roughly as drawn.

  4. Point gives the phase crossover. lies on the negative real axis, so and . The positive branch crosses the negative real axis only here, because the upper half of the loop stays above the axis until it reaches the origin. At the magnitude is about , so is not a gain crossover.

  5. Rule out and . is on the ray inside the circle: and . is on the ray inside the circle. The phase has already passed at and is still falling, so that angle means , and again . Neither point meets either crossover condition. That rules out (A), which makes the phase crossover, and (B), which makes the phase crossover. (B) and (C) also fail because they make the gain crossover, and (C) makes the phase crossover.

  6. Answer. is the gain crossover frequency and is the phase crossover frequency, which is option (D). As a check, the gain margin is . The phase margin is , roughly as drawn. The marks are not the phase margin. They mark the rays through and , and those points are distractors.

KEY IDEA

On a Nyquist plot, read each crossover from where the positive-frequency locus is, not from the angle marks. It crosses the unit circle at the gain crossover () and the negative real axis at the phase crossover ().

WATCH OUT FOR

Swapping the two definitions, which gives (C). Another error is to treat as special because it sits on the marked ray. It looks like a phase margin, but has , so it is neither crossover. is on the other ray at phase , not . Some students also assume is on the ray and write the phase margin as . In the figure is below that ray, so its phase is less lagging than .

From the GATE 2025 EC paper. Every question of this paper · Download the full paper · All 27 Bode & margins questions, with notes

More Bode & margins questions