
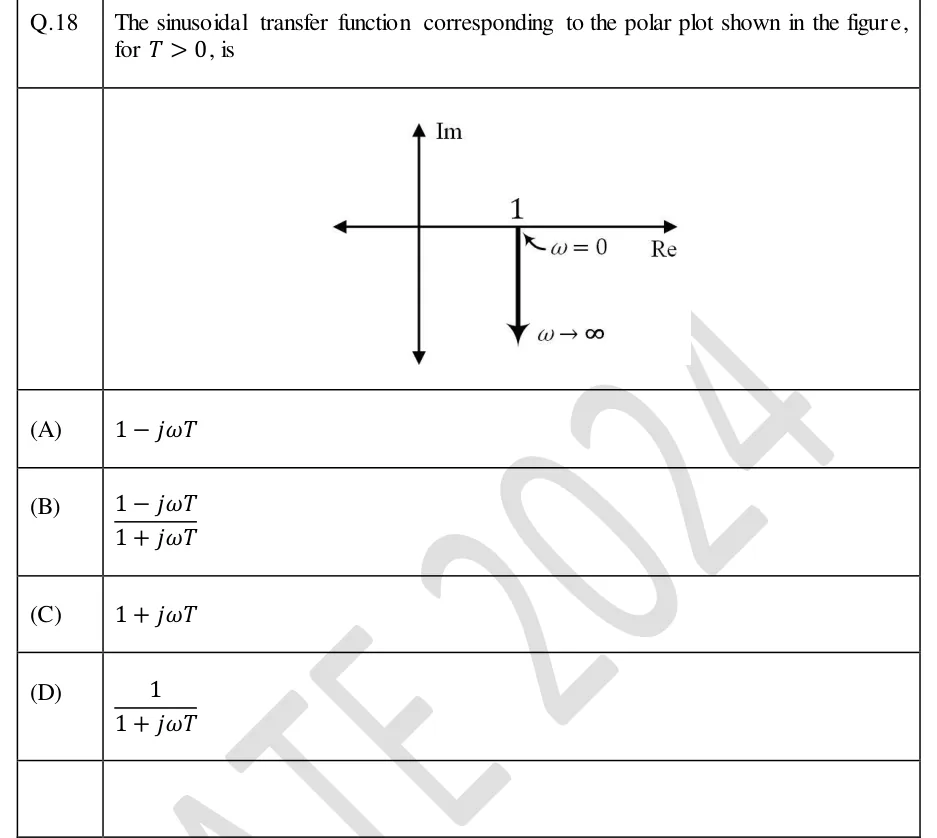
Q.18 The sinusoidal transfer function corresponding to the polar plot shown in the figure, for , is
 Tap to open full size
Figure description
Polar plot on Re–Im axes (horizontal axis labelled Re, vertical axis labelled Im, both drawn with arrows at both ends). The point 1 is marked on the positive real axis, labelled with an arrow as ω = 0. From this point a straight vertical line is drawn downward (parallel to the negative imaginary axis, at constant real part 1), ending in an arrowhead labelled ω → ∞. So the locus starts at 1 + j0 and runs straight down along Re = 1 towards -j ∞.
- (A)
- (B)
- (C)
- (D)