
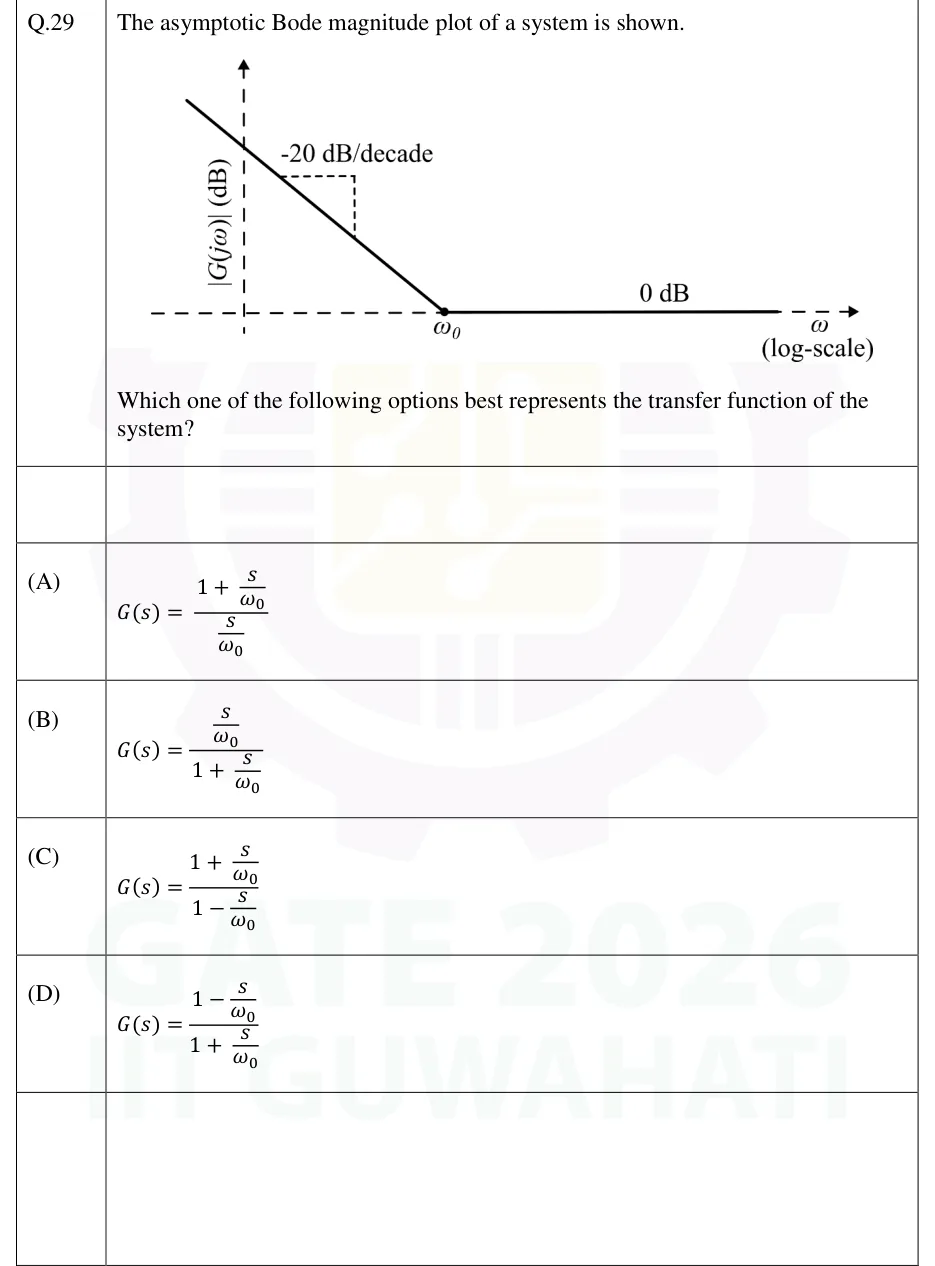
The asymptotic Bode magnitude plot of a system is shown.
[Figure]
Which one of the following options best represents the transfer function of the system?
 Tap to open full size
Figure description
Asymptotic Bode magnitude plot. Vertical axis: |G(j ω)| (dB), drawn as a dashed vertical line with an arrow. Horizontal axis: ω (log-scale), drawn as a dashed horizontal line at the 0 dB level with an arrow. The plot starts at the upper left (at frequencies below the vertical axis position, i.e. very low ω) as a straight line falling with slope labelled "-20 dB/decade" (a small dashed right-angle slope triangle drawn beside it). This falling line meets the 0 dB axis at a marked point (dot) labelled ω_0. From ω_0 onward the plot is a flat horizontal solid line labelled "0 dB" lying on the frequency axis, continuing to high frequencies. No other break points are shown.
- (A)
- (B)
- (C)
- (D)