
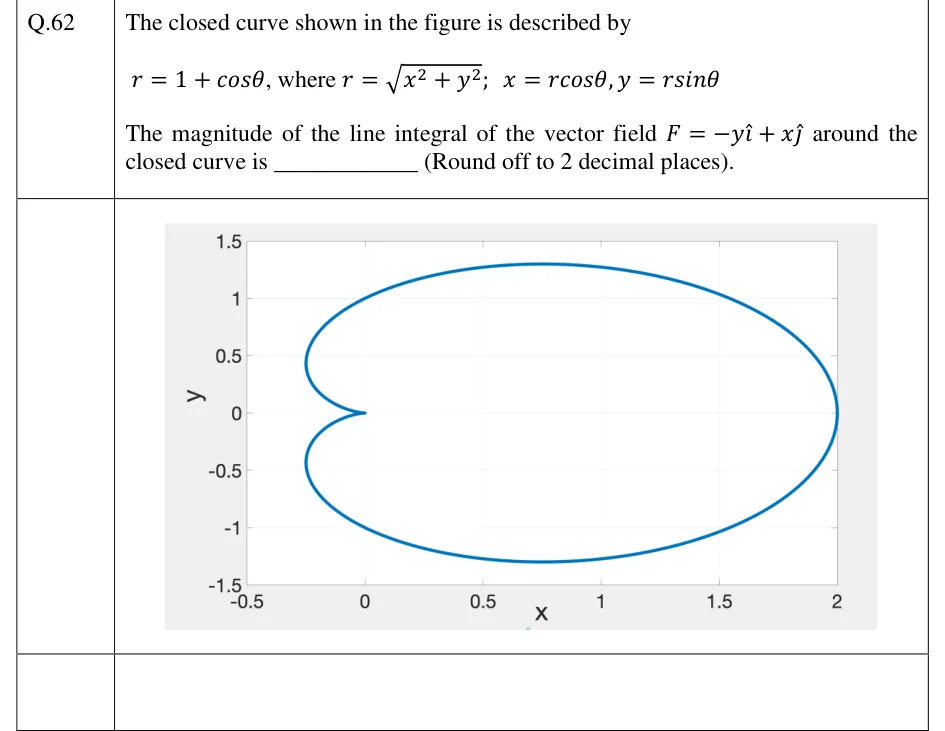
The closed curve shown in the figure is described by
, where ; ,
The magnitude of the line integral of the vector field around the closed curve is ______ (Round off to 2 decimal places).
 Tap to open full size
Figure description
Plot of a cardioid on x-y axes. The horizontal axis is labelled x, with ticks at -0.5, 0, 0.5, 1, 1.5, 2. The vertical axis is labelled y, with ticks at -1.5, -1, -0.5, 0, 0.5, 1, 1.5. The closed blue curve is the cardioid r = 1 + cos(theta). It has a cusp pointing inward at the origin (0, 0), its rightmost point at (2, 0), top and bottom extremes at about y = +1.3 and y = -1.3 near x = 0.75, and leftmost bulges at about x = -0.25 near y = +0.5 and y = -0.5. The curve is symmetric about the x-axis.