
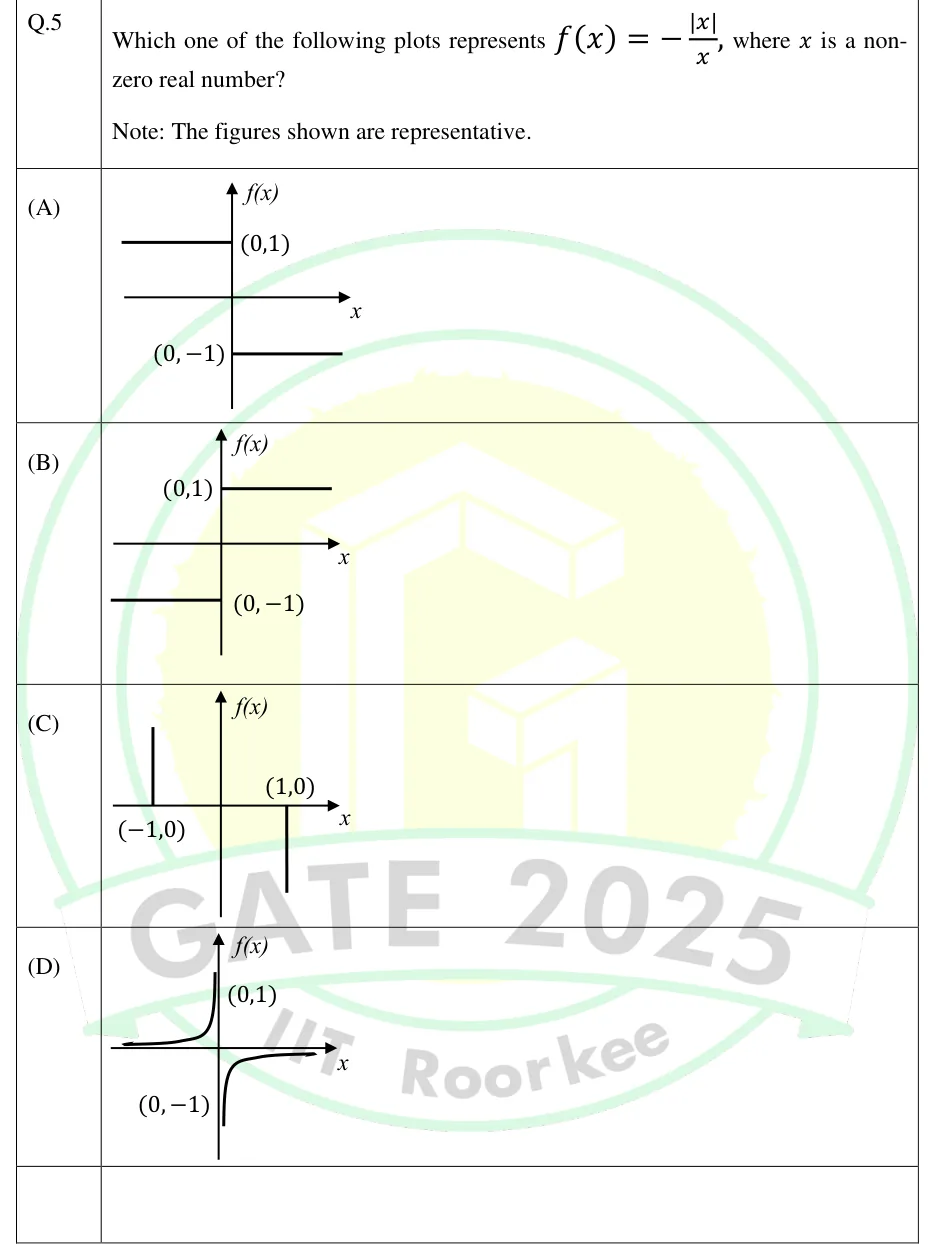
Which one of the following plots represents , where is a non-zero real number?
Note: The figures shown are representative.
 Tap to open full size
Figure description
Each option is a graph on axes with a horizontal x-axis (arrow to the right, labelled x) and a vertical f(x)-axis (arrow upward, labelled f(x)), crossing at the origin. (A) Two horizontal line segments: one to the LEFT of the vertical axis at height +1, ending at the axis at the point labelled (0,1); one to the RIGHT of the vertical axis at height -1, starting at the axis at the point labelled (0,-1). (B) The mirror image of (A): a horizontal segment to the RIGHT of the vertical axis at height +1, starting at the point labelled (0,1); a horizontal segment to the LEFT of the vertical axis at height -1, ending at the point labelled (0,-1). (C) Two vertical line segments: one at x = -1, labelled (-1,0) at its foot on the x-axis, rising upward from the x-axis; one at x = +1, labelled (1,0) at its top on the x-axis, going downward from the x-axis. (D) Two curved branches like a hyperbola-type graph: for x < 0 the curve starts close to the x-axis far left, stays just above it and shoots steeply up near the vertical axis towards the point labelled (0,1); for x > 0 the curve starts steeply from far below near the vertical axis at the point labelled (0,-1) and bends to approach the x-axis from below as x increases.
- (A)
Figure — horizontal segment at height 1 for x < 0 (ending at (0,1)), horizontal segment at height -1 for x > 0 (starting at (0,-1)).
- (B)
Figure — horizontal segment at height 1 for x > 0 (starting at (0,1)), horizontal segment at height -1 for x < 0 (ending at (0,-1)).
- (C)
Figure — vertical segment rising from the x-axis at (-1,0), and vertical segment falling from the x-axis at (1,0).
- (D)
Figure — two curved branches: for x < 0 the curve hugs the x-axis from above and rises steeply near the vertical axis towards (0,1); for x > 0 the curve rises from far below near (0,-1) and flattens towards the x-axis from below.