
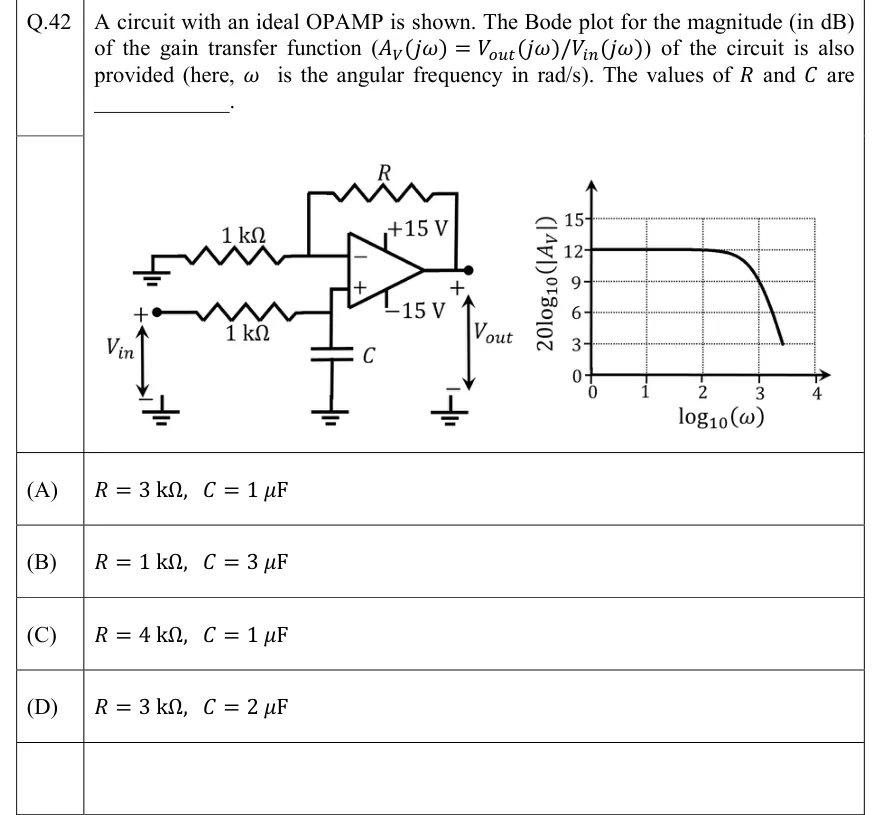
A circuit with an ideal OPAMP is shown. The Bode plot for the magnitude (in dB) of the gain transfer function of the circuit is also provided (here, is the angular frequency in rad/s). The values of and are ________.
 Tap to open full size
Figure description
Left: the circuit. It uses an ideal op-amp with supply rails +15 V and −15 V. The inverting (−) input goes to ground through a 1 kΩ resistor, and a feedback resistor R connects the output to the inverting input. The non-inverting (+) input sits on a node that is fed from the source V_in (+ terminal) through a series 1 kΩ resistor. A capacitor C runs from that same node to ground. V_in is applied between the left end of the 1 kΩ series resistor (+) and ground (−). V_out is taken between the op-amp output (+) and ground (−). Right: the Bode magnitude plot. The vertical axis is 20log10(|A_V|) in dB, with dotted grid lines at 0, 3, 6, 9, 12 and 15. The horizontal axis is log10(ω), with grid lines at 0, 1, 2, 3 and 4. The curve is flat at 12 dB from log10(ω) = 0 to about 2. It then bends down gently, passes through the grid intersection at 9 dB and log10(ω) = 3, and keeps falling more steeply. The plotted curve ends at 3 dB near log10(ω) ≈ 3.4 to 3.5.
- (A)
- (B)
- (C)
- (D)