IAE Academy

GATE DA

Data types and data transformation

Normalisation, discretisation, sampling and compression

This topic covers how attribute values are classified (nominal, ordinal, interval, ratio; discrete or continuous) and how raw data is prepared for analysis: rescaling (normalisation), grouping into bins (discretisation), drawing a subset (sampling) and shrinking (compression and reduction). Most calculations here are short — scale a value, form and smooth bins, find a sampling probability or allocation, size a code — and each depends on using the exact formula and stating its convention.

1 previous-year question · 1 solved · 7 practice questions

Data types: the four measurement scales

An attribute is classified in two independent ways. By measurement scale it is nominal, ordinal, interval or ratio. By value set it is discrete (finite or countably infinite set of values, such as counts or categories) or continuous (any real value in a range, such as length). Each scale allows every operation of the one before it plus more, so the scales are nested.

Scale

Meaningful operations

Typical summary

Example

Nominal

equal or not equal

mode

blood group, postal code, colour

Ordinal

equal, order (<, >)

mode, median

grade A/B/C, size S/M/L/XL

Interval

equal, order, differences (+, -)

mode, median, mean, standard deviation

temperature in Celsius, calendar year

Ratio

equal, order, differences, ratios (x, /)

all, including geometric mean

length, mass, age, temperature in kelvin, a count

The deciding feature of ratio data is a true zero: zero means none of the quantity, so 40 kg is twice 20 kg. Celsius has an arbitrary zero, so 40 degrees Celsius is not twice as hot as 20 degrees; the scale is interval. Differences are meaningful on an interval scale, ratios are not.

Quick classification procedure

  1. Values are only labels with no order: nominal.

  2. Values have an order but gaps between them are not meaningful (grades, ratings): ordinal.

  3. Gaps are equal and meaningful but zero is arbitrary: interval.

  4. Zero means absence and ratios make sense: ratio.

  5. Separately: can the values be listed one by one (discrete) or do they fill an interval (continuous)?

EXAM TIP

A numeric-looking attribute is not automatically interval or ratio. A postal code or a roll number is nominal, and a 1-to-5 satisfaction rating is ordinal. Also, a count (number of items) is discrete but ratio, and a binary attribute with two labels is nominal (symmetric or asymmetric depending on whether both outcomes are equally important).

Normalisation: rescaling attribute values

Here normalisation means data transformation to a common scale, not the database normal forms of schema design. It is applied to numeric attributes so that an attribute measured in large units (income) does not dominate distance computations over one measured in small units (age). Three methods are standard. In all of them below, is an original value of the attribute and the transformed one; , , and are computed from the attribute's values in the data.

MIN-MAX NORMALISATION TO [NEW_MIN, NEW_MAX]

Linear map of the observed range onto the target range; for [0,1] it reduces to (v - min)/(max - min). Preserves the shape of the distribution and the order of values. Undefined when max = min (all values equal).

Z-SCORE NORMALISATION

Result has mean 0 and standard deviation 1 (under the same convention for sigma). Convention: use the population standard deviation (divide by n) unless the question says sample (divide by n - 1). Not bounded to a fixed range; undefined when sigma = 0. A variant divides by the mean absolute deviation s = (1/n) times the sum of |v - mean| instead of sigma; it is less affected by outliers because deviations are not squared.

DECIMAL SCALING

Moves the decimal point; j is fixed by the value of largest absolute magnitude. Result lies strictly inside (-1, 1). Examples: max|v| = 986 gives j = 3; max|v| = 1000 gives j = 4.

Method

Output range

Affected by outliers?

Keeps order?

Min-max

fixed (for example [0,1])

strongly: one extreme value squeezes the rest into a small part of the range

yes

Z-score

unbounded

yes: an outlier shifts the mean and inflates sigma, but the other values are not forced into a fixed interval

yes

Decimal scaling

(-1, 1)

only through the largest absolute value

yes

WORKED EXAMPLE

The values 2, 4, 4, 4, 5, 5, 7, 9 are to be normalised. (a) Min-max to [0,1] for the value 7. (b) Z-score for the value 9 using the population standard deviation.

Solution
  1. Min-max: min = 2, max = 9, so .

  2. Mean = (2+4+4+4+5+5+7+9)/8 = 40/8 = 5.

  3. Squared deviations: 9, 1, 1, 1, 0, 0, 4, 16, which sum to 32.

  4. Population variance = 32/8 = 4, so .

  5. Z-score of 9 = (9 - 5)/2 = 2. With the sample sd the value would be .

Answer: (a) 5/7, about 0.714. (b) 2 (population sd); about 1.87 if the sample sd is specified.

EXAM TIP

Min-max with a new value outside the original [min, max] gives a result outside the target range (an out-of-bounds error). Decimal scaling needs max|v'| strictly less than 1: if the largest absolute value is 1000, then j = 4 (giving 0.1), not 3 (giving exactly 1).

Discretisation: converting numeric values into bins

Discretisation replaces a continuous or finely valued attribute by a small number of intervals (bins), each of which may carry a label. It reduces data size and prepares data for methods that need categorical input. The two simple unsupervised methods are equal-width and equal-frequency binning, with bins chosen in advance.

EQUAL-WIDTH BINNING

Bins have the same width and usually unequal counts. Convention here: left-closed, right-open, with the last bin closed so the maximum belongs to it.

EQUAL-FREQUENCY (EQUAL-DEPTH) BINNING

Sort the data and put n/k consecutive values in each bin; widths differ. If k does not divide n, bin sizes are floor(n/k) or ceil(n/k) and the question must say which bins take the extra values. Tied values may need to share a bin.

Smoothing a binned attribute

  1. Smoothing by bin means: replace every value in a bin by the mean of that bin.

  2. Smoothing by bin medians: replace by the bin median.

  3. Smoothing by bin boundaries: replace each value by the nearer of the bin's minimum and maximum; a value exactly midway goes to either (state the rule if it matters).

WORKED EXAMPLE

Sorted data: 4, 8, 15, 21, 21, 24, 25, 28, 34. (a) Partition into 3 equal-frequency bins and smooth by bin means. (b) How many values fall in each of 3 equal-width bins? (c) Smooth the equal-frequency bins of (a) by bin boundaries.

Solution
  1. Equal-frequency depth = 9/3 = 3: bins (4, 8, 15), (21, 21, 24), (25, 28, 34).

  2. Bin means: 27/3 = 9, 66/3 = 22, 87/3 = 29, so the smoothed data is 9, 9, 9, 22, 22, 22, 29, 29, 29.

  3. Equal width: w = (34 - 4)/3 = 10, giving [4,14), [14,24), [24,34].

  4. 4 and 8 are in bin 1; 15, 21, 21 are in bin 2 (24 is not below 24); 24, 25, 28, 34 are in bin 3.

  5. Boundaries, bin 1 (min 4, max 15): 8 is 4 from 4 and 7 from 15, so it becomes 4: result 4, 4, 15.

  6. Bin 2 (min 21, max 24): 21, 21, 24 are already boundaries.

  7. Bin 3 (min 25, max 34): 28 is 3 from 25 and 6 from 34, so it becomes 25: result 25, 25, 34.

Answer: (a) 9, 9, 9, 22, 22, 22, 29, 29, 29. (b) 2, 3 and 4 values. (c) 4, 4, 15, 21, 21, 24, 25, 25, 34.

ENTROPY-BASED (SUPERVISED) SPLIT

D_1 and D_2 are the tuples with attribute value at most, and above, the candidate split point T; p_i is the fraction of a set in class i. Choose the T that minimises Info_T(D), which is the same as maximising the information gain Entropy(D) - Info_T(D). Apply recursively to each part until a stopping rule is met.

Other discretisation methods

  1. Histogram analysis: the bins of an equal-width or equal-frequency histogram become the intervals.

  2. Cluster analysis: values are grouped into clusters, and each cluster becomes an interval.

  3. ChiMerge (supervised, bottom-up): start with each distinct value as its own interval and repeatedly merge the adjacent pair with the lowest chi-square value, that is, the pair whose class distributions are most alike.

  4. Concept hierarchy: replace low-level values by higher-level concepts (age 23 to 'young'; city to state to country).

EXAM TIP

Outliers can distort equal-width bins: most values may fall into a few bins while others stay empty. Equal-frequency bins handle skew better. Always sort before binning by frequency, and always check whether a boundary value belongs to the lower or upper bin.

Sampling

Sampling chooses a subset of the tuples to work with, trading accuracy for speed. In a probability sample each tuple's chance of selection is known, which is what lets the sample be used to estimate quantities of the whole population.

Method

How it works

Use when

Simple random without replacement (SRSWOR)

draw n distinct tuples, every subset of size n equally likely

population fairly uniform

Simple random with replacement (SRSWR)

each draw is independent and uniform over all N tuples; a tuple may repeat

bootstrap resampling; analyses that assume independent draws

Stratified

split into non-overlapping strata, sample within every stratum

strata differ and small groups must not be missed

Cluster (one-stage)

pick whole clusters at random and keep all tuples in them

population is naturally grouped; cheaper to access

Systematic

take every k-th tuple from a random start

ordered list with no periodic pattern

INCLUSION PROBABILITY, SRSWOR

Sample of n distinct tuples from N, all subsets equally likely.

INCLUSION PROBABILITY, SRSWR

n independent draws, each tuple chosen with probability 1/N per draw; N^n ordered outcomes.

EXPECTED NUMBER OF DISTINCT TUPLES, SRSWR

By linearity of expectation over the N tuples. The limit is the bootstrap fact: a with-replacement sample of size N contains about 63.2% of the distinct tuples, and about 36.8% never appear.

PROPORTIONAL ALLOCATION IN STRATIFIED SAMPLING

Stratum h of size N_h receives a share of the total sample n in proportion to its size; round so that the n_h sum to n.

SYSTEMATIC SAMPLING

When N = nk exactly, every tuple has inclusion probability 1/k = n/N, but only k distinct samples are possible.

EXAM TIP

Under SRSWR the sample can contain duplicates, so a sample of size n has at most n distinct tuples. Cluster sampling selects groups, not individual tuples, so within a chosen cluster every tuple is taken; stratified sampling samples from every stratum.

Compression and data reduction

Data compression re-encodes data in fewer bits. It is lossless if the original can be rebuilt exactly (run-length encoding, Huffman coding, dictionary methods) and lossy if only an approximation can be rebuilt (quantisation, wavelet or transform coefficients with small terms dropped). Data reduction also includes dimensionality reduction (keep fewer attributes or components, as in principal components, which keeps the directions of largest variance) and numerosity reduction, which replaces the data by a smaller representation: parametric (a regression or log-linear model, storing only its parameters) or non-parametric (a histogram, clusters or a sample).

COMPRESSION RATIO

A ratio above 1 means the data shrank. Space saving = 1 - compressed/original.

FIXED-LENGTH CODE SIZE

For an alphabet of m >= 2 distinct symbols. A Huffman code never needs more bits per symbol on average than this, and needs fewer for some unequal frequency distributions (not all: probabilities 0.3, 0.3, 0.2, 0.2 give Huffman lengths 2, 2, 2, 2).

AVERAGE CODE LENGTH AND THE ENTROPY BOUND

p_i is the probability (relative frequency) of symbol i and l_i its code length in bits. No lossless symbol-by-symbol prefix code averages below H; Huffman's code is optimal among them and reaches H exactly when every p_i is a power of 1/2.

WORKED EXAMPLE

A string of 50 characters over the 4 symbols A, B, C, D is stored with a fixed-length code. The same string is run-length encoded as 6 (symbol, count) pairs, each pair needing 2 bits for the symbol and 6 bits for the count. Find both sizes and the compression ratio.

Solution
  1. Fixed length: bits per symbol, so 50 x 2 = 100 bits.

  2. Run-length: 6 pairs x (2 + 6) = 48 bits.

  3. Ratio = .

Answer: 100 bits and 48 bits; ratio about 2.08.

WORKED EXAMPLE

Symbols A, B, C, D occur with probabilities 0.5, 0.25, 0.125, 0.125. Find the Huffman code lengths, the average code length and the entropy, and compare with a fixed-length code.

Solution
  1. Merge the two smallest: C + D = 0.25. Then B + (CD) = 0.5. Then A + (BCD) = 1.

  2. Code lengths: A 1, B 2, C 3, D 3.

  3. Average length = 0.5(1) + 0.25(2) + 0.125(3) + 0.125(3) = 0.5 + 0.5 + 0.375 + 0.375 = 1.75 bits.

  4. Entropy = 0.5(1) + 0.25(2) + 0.125(3) + 0.125(3) = 1.75 bits, because every probability is a power of 1/2.

  5. Fixed length: bits.

Answer: Lengths 1, 2, 3, 3; average 1.75 bits per symbol, equal to the entropy; the fixed-length code needs 2 bits.

EXAM TIP

Lossless compression never changes any value; lossy compression and discretisation both lose detail, but compression is a storage encoding while discretisation changes the values the analysis sees. Run-length encoding helps only where long runs of equal values exist (sorted or sparse columns).

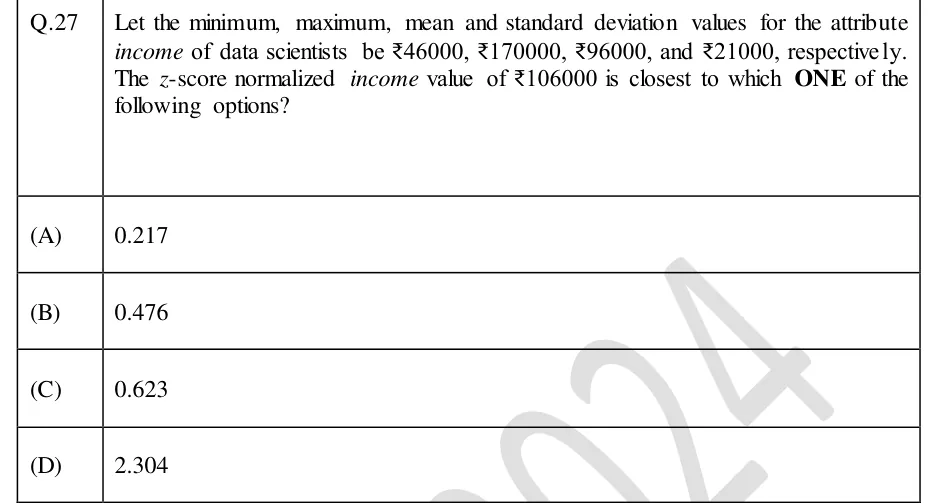
PREVIOUS-YEAR QUESTIONS

1 question from the DA papers

Try each question first, then open the answer. We placed each question under a topic ourselves; the exam paper does not label topics.

See these papers in full: GATE DA 2024

PRACTICE

7 questions to test yourself

PRACTICE 11 mark · NAT

The attribute Score has an observed minimum of 20 and maximum of 220. A value of 70 is rescaled by min-max normalisation to the range [-1, 1]. Find the rescaled value.

Answer and solution

Answer: (accepted range )

  1. (70 - 20)/(220 - 20) = 50/200 = 0.25.

  2. v' = -1 + 0.25 x (1 - (-1)) = -1 + 0.5 = -0.5.

PRACTICE 21 mark · MSQ

Which of the following attributes are measured on a ratio scale?

  1. (A)

    Temperature in kelvin

  2. (B)

    Temperature in Celsius

  3. (C)

    Length of a bolt in centimetres

  4. (D)

    Postal code of a customer

Answer and solution

Answer: (A), (C)

  1. Kelvin has a true zero (absence of thermal energy), and length has a true zero, so ratios are meaningful: ratio scale.

  2. Celsius has an arbitrary zero: interval.

  3. Postal code is a label: nominal.

PRACTICE 32 marks · NAT

The data set 6, 8, 8, 8, 9, 9, 11, 13 is z-score normalised using the SAMPLE standard deviation (divisor n - 1). Find the sum of the squares of the eight normalised values.

Answer and solution

Answer: (accepted range )

  1. Mean = 72/8 = 9.

  2. Sum of squared deviations = 9 + 1 + 1 + 1 + 0 + 0 + 4 + 16 = 32.

  3. Sample variance .

  4. Sum of = (sum of squared deviations)/ = 32/(32/7) = 7, which equals n - 1.

PRACTICE 42 marks · NAT

The sorted values 5, 7, 12, 14, 20, 22, 30, 36 are placed in 4 equal-frequency bins (two values per bin) and every value is replaced by the mean of its bin. Find the total squared error, the sum over all eight values of (original - smoothed)^2.

Answer and solution

Answer: (accepted range )

  1. Bins: (5, 7), (12, 14), (20, 22), (30, 36) with means 6, 13, 21, 33.

  2. Squared errors per bin: 1+1 = 2, 1+1 = 2, 1+1 = 2, 9+9 = 18.

  3. Total = 2 + 2 + 2 + 18 = 24.

PRACTICE 52 marks · MCQ

A table has 10 tuples. A sample of size 3 is drawn by simple random sampling WITH replacement, each draw choosing one tuple uniformly and independently. What is the probability that a particular given tuple appears at least once in the sample?

  1. (A)

    0.300

  2. (B)

    0.271

  3. (C)

    0.729

  4. (D)

    0.100

Answer and solution

Answer: (B)

  1. Probability the tuple is missed in one draw = 9/10.

  2. Missed in all three independent draws = .

  3. At least once = 1 - 0.729 = 0.271. (0.300 would be the answer for sampling without replacement, 3/10.)

PRACTICE 61 mark · MCQ

The values of an attribute range from -986 to 917. The attribute is normalised by decimal scaling, with j the smallest non-negative integer for which every transformed value has absolute value less than 1. What does the value -986 become?

  1. (A)

    -9.86

  2. (B)

    -0.986

  3. (C)

    -0.0986

  4. (D)

    -0.00986

Answer and solution

Answer: (B)

  1. The largest absolute value is 986.

  2. j = 2 gives 9.86, not below 1; j = 3 gives 0.986, below 1. So j = 3 (equivalently floor(log10 986) + 1 = 2 + 1 = 3).

  3. -986 / 10^3 = -0.986.

PRACTICE 71 mark · NAT

A table of 2,000 tuples is divided into three strata of sizes 1,000, 600 and 400. A stratified sample of 50 tuples is drawn with proportional allocation. How many tuples are drawn from the stratum of size 600?

Answer and solution

Answer:

  1. .

  2. = 30000/2000 = 15. (The other strata get 25 and 10; 25 + 15 + 10 = 50, so no rounding is needed.)

OFFICIAL GATE 2027 SYLLABUS WORDING

Copied from the GATE 2027 syllabus; see all 2027 syllabi.

GATE DA

data types, data transformation such as normalization, discretization, sampling, compression

Preparing in Kolkata? IAE Academy's course for GATE DA.