IAE Academy

GATE DA

Data warehouse modelling

Multidimensional schemas, concept hierarchies and measures

A data warehouse stores integrated, historical data organised around business dimensions, so that aggregate questions can be answered quickly. For GATE DA you must know the star, snowflake and fact-constellation schemas, how concept hierarchies and OLAP operations move around a data cube, how to count cuboids, groupings and cells, and how to classify and compute measures (distributive, algebraic, holistic; additive, semi-additive, non-additive).

3 previous-year questions · 3 solved · 6 practice questions

Data warehouse versus operational database

An operational database (OLTP) supports day-to-day transactions: many short reads and updates on current, detailed data. A data warehouse (OLAP) supports analysis: it is subject-oriented, integrated from several sources, time-variant (it keeps history) and non-volatile (data is loaded and read, not updated in place).

Feature

Operational database (OLTP)

Data warehouse (OLAP)

Purpose

Run the business, record transactions

Analyse and decide

Data

Current, detailed, normalised

Historical, summarised and detailed, often denormalised

Typical access

Short read/write transactions touching few rows

Long read-mostly queries scanning and aggregating many rows

Design

Entity-relationship, normalised

Multidimensional (star, snowflake, constellation)

Updates

Frequent, in place

Periodic bulk load; no in-place update

Users

Clerks, application programs

Analysts, managers

EXAM TIP

If a question describes a few-row lookup or an update, it is OLTP. If it aggregates a measure over many rows grouped by several attributes, it is OLAP.

Multidimensional model: facts, dimensions and the data cube

A fact table holds the numeric measures (for example Sales.amount, Sales.units) plus a foreign key to each dimension. A dimension table describes one business perspective (time, product, location, customer) with descriptive attributes. A data cube is the logical picture of this: each dimension is an axis and each cell stores the measure for one combination of dimension values.

A cuboid is the cube aggregated at one chosen level of each dimension. The cuboid with every dimension at its lowest level is the base cuboid. The cuboid with every dimension rolled up to 'all' is the apex cuboid and has exactly one cell (the grand total). The lattice of all cuboids is the full data cube.

Facts to remember

  1. The fact table is usually the largest table; dimension tables are small by comparison.

  2. The key of a fact table is typically the combination of its dimension foreign keys.

  3. A measure is numeric and is aggregated; a dimension attribute is used to group and filter.

  4. A cell of the base cuboid is a base cell; a cell of any other cuboid (at least one dimension aggregated) is an aggregate cell.

  5. A factless fact table has foreign keys but no measure column; it records that an event happened (for example a student attending a lecture), and counting its rows gives the measure.

Schemas: star, snowflake and fact constellation

Schema

Structure

Trade-off

Star

One central fact table; each dimension is a single, denormalised table joined directly to the fact table

Fewest joins, fast queries; dimension tables carry redundancy

Snowflake

Like star, but dimension tables are normalised into several related tables (for example Product to Brand to Category)

Less redundancy and storage; more joins, so slower queries

Fact constellation (galaxy)

Several fact tables that share one or more dimension tables

Models several related business processes; more complex

The word 'schema' here describes the layout of tables. In a star schema a whole concept hierarchy (such as day, month, quarter, year) is flattened into columns of one dimension table. In a snowflake schema the same hierarchy is split across tables.

EXAM TIP

Counting joins: to reach an attribute at the top of a hierarchy, a star schema needs one join (fact table to the dimension table), while a snowflake schema needs one join for each normalised table on the path (fact to Product, Product to Brand, Brand to Category: three joins). A schema with two fact tables sharing a dimension is a fact constellation, not a snowflake.

Concept hierarchies and OLAP operations

A concept hierarchy maps low-level values to higher-level concepts, for example street, city, state, country for location, or day, month, quarter, year for time. It can be a total order (day to month to quarter to year) or a partial order / lattice (day to week and day to month, where week does not roll up to month). Convention used throughout these notes: the implicit top level 'all' is not counted as a level of the hierarchy.

OLAP operation

What it does

Roll-up

Aggregate up a concept hierarchy (city to country) or drop a dimension entirely; fewer, coarser cells

Drill-down

Reverse of roll-up: step down a hierarchy to finer detail, or add a dimension

Slice

Fix one dimension to a single value; result is a sub-cube with one fewer dimension

Dice

Select a sub-cube by restricting two or more dimensions to sets or ranges of values

Pivot (rotate)

Rotate the axes of the view to present the data from another orientation; no data change

Convention for SQL here: keywords in capitals; SQL works on bags (duplicates kept). GROUP BY CUBE (a, b) computes the aggregate for every one of the groupings: , , and the grand total . In the output, a column that has been aggregated over is shown as NULL; the function GROUPING(col) returns 1 for such a super-aggregate NULL and 0 otherwise, which separates it from a NULL stored in the data.

SELECT
  region,
  year,
  SUM(amount)
FROM Sales
GROUP BY CUBE (region, year);

GROUP BY ROLLUP (a, b) computes only the groupings obtained by dropping columns from the right: , and , that is groupings for columns. The column order matters for ROLLUP (it models one hierarchy, such as year then month) but not for CUBE.

SELECT
  region,
  year,
  SUM(amount)
FROM Sales
GROUP BY ROLLUP (region, year);

Counting cuboids, groupings and cells

CUBOIDS WITH NO HIERARCHIES

n dimensions, each with a single level (apart from 'all'). Each dimension is either present or rolled up to all.

CUBOIDS WITH EXACTLY K DIMENSIONS (NO HIERARCHIES)

Choose which k of the n dimensions stay; summing over k = 0 to n gives 2^n.

CUBOIDS WITH CONCEPT HIERARCHIES

L_i is the number of distinct levels of dimension i, excluding the virtual top level 'all'; the +1 accounts for 'all'. A cuboid picks one level (or 'all') per dimension, so this holds for a total order and for a lattice; in a lattice count every level once (day, week, month gives L = 3).

GROUPINGS COMPUTED BY CUBE AND ROLLUP

Both counts include the grand total ().

MAXIMUM CELLS IN THE BASE CUBOID

c_i is the number of distinct values of dimension i at its lowest level; this is an upper bound that is reached only if every combination occurs.

CELLS IN THE WHOLE CUBE (NO HIERARCHIES)

Each dimension contributes its c_i values or the single value 'all' (written *). Counts every cell of every cuboid, assuming all combinations are non-empty. With hierarchies, replace c_i + 1 by 1 plus the total number of distinct values over all levels of dimension i.

WORKED EXAMPLE

A cube has three dimensions: time with levels day, month, quarter, year; location with levels city, state, country; product with levels item and brand. How many cuboids does the full cube have?

Solution
  1. Levels excluding all: , , .

  2. Each dimension contributes choices, so .

  3. .

Answer: 60 cuboids

EXAM TIP

Do not forget the +1 for 'all'. With no hierarchies the formula reduces to , because each gives .

Materialisation. Pre-computing every cuboid (full materialisation) answers any aggregate query fastest but can need very large storage; computing nothing in advance (no materialisation) saves space but every query aggregates from the base data; partial materialisation pre-computes a chosen subset of cuboids. An iceberg cube stores only the cells whose measure (typically count) meets a minimum threshold, which avoids storing the many sparse cells of a high-dimensional cube.

Measures: distributive, algebraic, holistic

Measures are categorised by how an aggregate over a whole data set can be computed from aggregates over its partitions (for example the cells of a finer cuboid). This decides whether a coarse cuboid can be built from a finer one without rereading the base data.

Category

Definition

Examples

Distributive

The aggregate of the whole set is obtained by combining one aggregate value per partition with a distributive function

sum, min, max (combine partition results with the same function); count (combine partition counts by sum)

Algebraic

Computable by an algebraic function of a bounded number M of values per partition, each obtained by a distributive function

avg = sum/count (M = 2); variance and standard deviation from count, sum and sum of squares (M = 3); min_N, max_N for a fixed N; center of mass

Holistic

No constant bound on the size of the summary that each partition must keep

median, mode, rank, count of distinct values (each partition must keep its set of distinct values, which is unbounded)

AVERAGE FROM DISTRIBUTIVE PARTS

s_j and n_j are the sum and count of partition j. The average of the partition averages differs from this in general; it is guaranteed to equal it only when all n_j are equal.

VARIANCE FROM SUMS (POPULATION)

Needs only count N, sum and sum of squares, each distributive, so variance is algebraic with M = 3. Population variance (divide by N).

VARIANCE FROM SUMS (SAMPLE)

Sample variance (divide by N - 1), from the same three distributive values; still algebraic.

WORKED EXAMPLE

Daily sales are stored in three partitions with (sum, count) = (120, 8), (45, 5) and (35, 7). Find the overall average. Can the overall median be found from the three partition medians?

Solution
  1. Total sum ; total count .

  2. Average .

  3. The mean of the partition averages is not the overall average.

  4. Median is holistic: partition medians do not determine the median of the union.

Answer: Average = 10; no, the median is holistic and needs the underlying data

EXAM TIP

To classify a measure, ask what each partition must keep. One value per partition, combined by a distributive function: distributive. A fixed number M of distributive values per partition, combined by a formula: algebraic. No fixed-size summary is enough: holistic. Variance is algebraic, not holistic.

A second, independent classification asks along which dimensions a stored measure may be summed. It is separate from the distributive / algebraic / holistic classes: for example, average is algebraic and also non-additive.

Category

Definition

Examples

Additive

Can be summed along every dimension

Sales.amount, units sold

Semi-additive

Can be summed along some dimensions but not others

Account balance or stock level: summed over branches, but not over time (over time use the closing value or the average)

Non-additive

Cannot be summed along any dimension

Ratios, percentages, unit price; compute them from additive parts, e.g. margin = total profit / total revenue

PREVIOUS-YEAR QUESTIONS

3 questions from the DA papers

Try each question first, then open the answer. We placed each question under a topic ourselves; the exam paper does not label topics.

See these papers in full: GATE DA 2026 · GATE DA 2025

GATE 2026 DA Q.18

GATE 2026 · DAQ.18 · 1 mark · MCQ

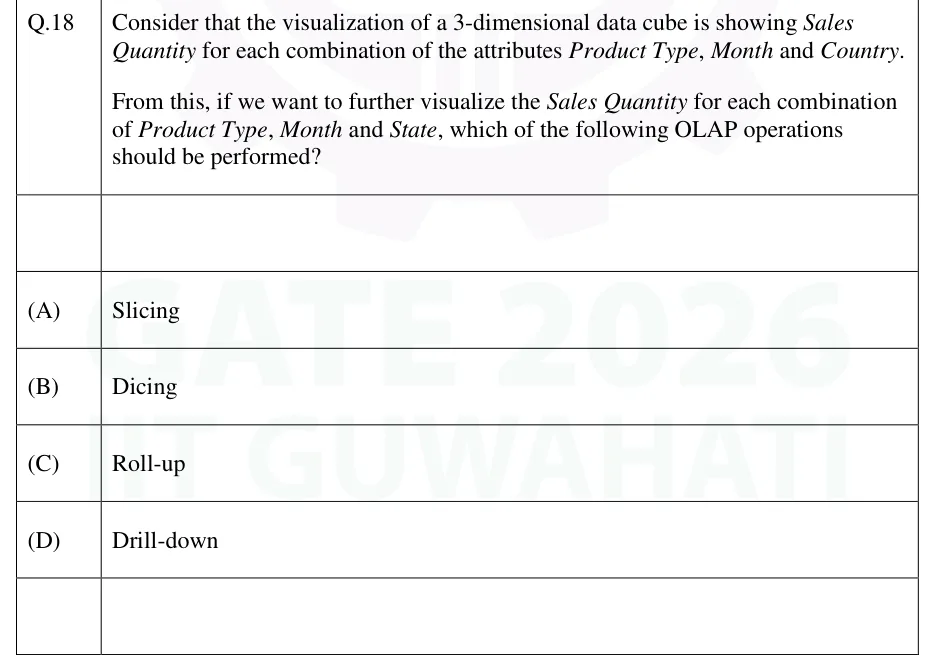
Consider that the visualization of a 3-dimensional data cube is showing Sales Quantity for each combination of the attributes Product Type, Month and Country.

From this, if we want to further visualize the Sales Quantity for each combination of Product Type, Month and State, which of the following OLAP operations should be performed?

  1. (A)

    Slicing

  2. (B)

    Dicing

  3. (C)

    Roll-up

  4. (D)

    Drill-down

Answer and solution
See the question in the paper
GATE 2026 DA Q.18: answer and solution

GATE 2026 DA Q.43

GATE 2026 · DAQ.43 · 2 marks · MCQ

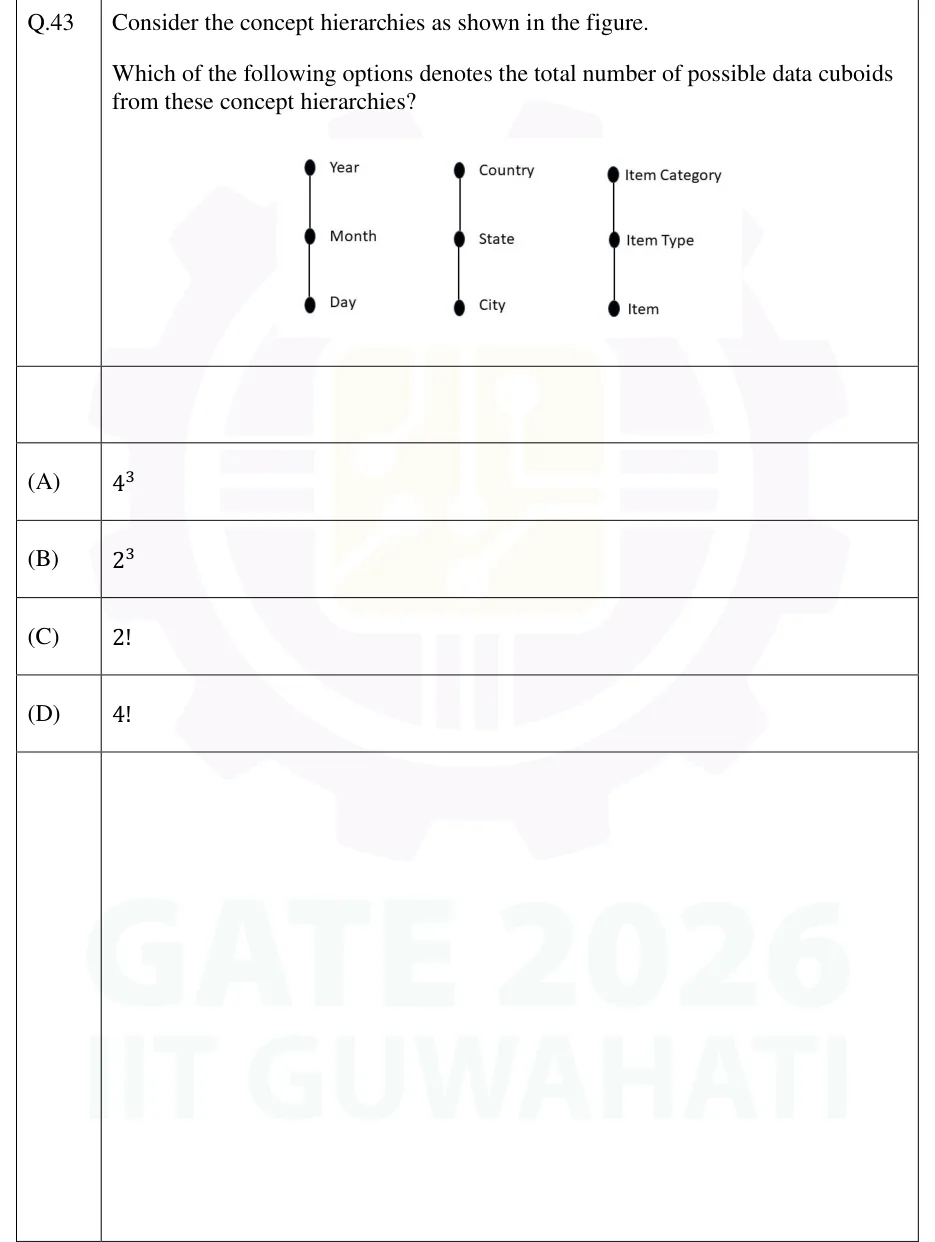
Consider the concept hierarchies as shown in the figure.

Which of the following options denotes the total number of possible data cuboids from these concept hierarchies?

GATE 2026 DA question 43: Three vertical concept hierarchies drawn side by side, each a chain of three nodes joined by a line, top to bottom.Tap to open full size
Figure from the GATE 2026 DA paper. It is part of the question.
Figure description

Three vertical concept hierarchies drawn side by side, each a chain of three nodes joined by a line, top to bottom. Hierarchy 1 (time): Year, Month, Day. Hierarchy 2 (location): Country, State, City. Hierarchy 3 (item): Item Category, Item Type, Item. Each chain has three levels.

  1. (A)

  2. (B)

  3. (C)

  4. (D)

Answer and solution
GATE 2026 DA Q.43: answer and solution

GATE 2025 DA Q.46

GATE 2025 · DAQ.46 · 2 marks · MCQ

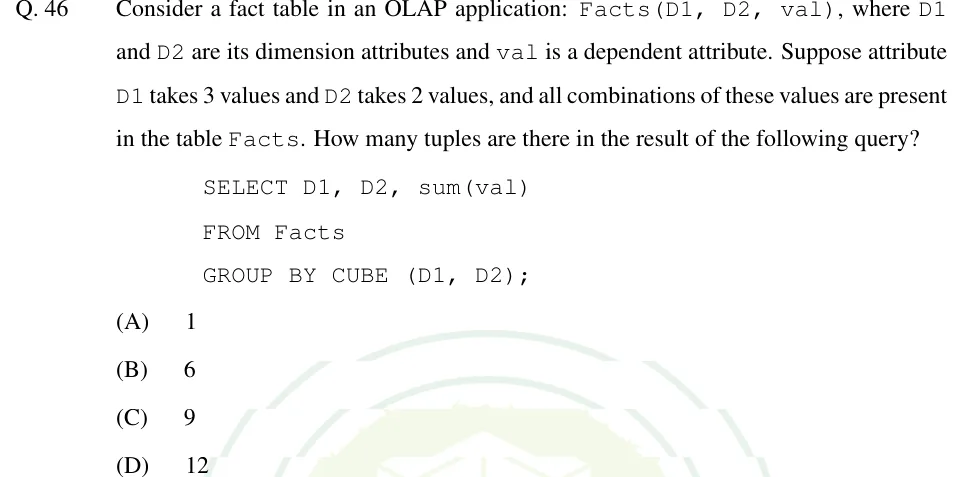
Consider a fact table in an OLAP application: Facts(D1, D2, val), where D1 and D2 are its dimension attributes and val is a dependent attribute. Suppose attribute D1 takes 3 values and D2 takes 2 values, and all combinations of these values are present in the table Facts. How many tuples are there in the result of the following query?

SELECT D1, D2, sum(val)
FROM Facts
GROUP BY CUBE (D1, D2);
  1. (A)

    1

  2. (B)

    6

  3. (C)

    9

  4. (D)

    12

Answer and solution
See the question in the paper
GATE 2025 DA Q.46: answer and solution

PRACTICE

6 questions to test yourself

PRACTICE 12 marks · NAT

A data cube has four dimensions. Dimension A has the levels a1, a2, a3 (a total order), dimension B has the levels b1, b2 (a total order), dimension C has the single level c1, and dimension D has the single level d1. The virtual level 'all' is not counted among these levels. How many cuboids does the full data cube contain?

Answer and solution

Answer:

  1. Levels excluding all: 3, 2, 1, 1.

  2. Each dimension contributes choices: 4, 3, 2, 2.

  3. Product .

PRACTICE 21 mark · MCQ

Which one of the following measures is holistic?

  1. (A)

    sum

  2. (B)

    count

  3. (C)

    median

  4. (D)

    variance (population)

Answer and solution

Answer: (C)

  1. sum and count are distributive.

  2. Population variance is algebraic: it is computed from count, sum and sum of squares.

  3. The median cannot be built from any bounded-size summary of partitions, so it is holistic.

PRACTICE 31 mark · MSQ

Select ALL the correct statements about data warehouse schemas.

  1. (A)

    A snowflake schema normalises its dimension tables, reducing redundancy but requiring more joins.

  2. (B)

    A star schema has one fact table and one denormalised table for each dimension.

  3. (C)

    A fact constellation contains exactly one fact table.

  4. (D)

    Drill-down aggregates data to a coarser level of a concept hierarchy.

Answer and solution

Answer: (A), (B)

  1. A is true by definition of snowflake.

  2. B is true by definition of star.

  3. C is false: a fact constellation has several fact tables sharing dimensions.

  4. D is false: that describes roll-up; drill-down moves to finer detail.

PRACTICE 41 mark · NAT

Sales amounts are held in three partitions with (sum, count) = (150, 5), (90, 9) and (60, 6). Compute the overall average amount.

Answer and solution

Answer:

  1. Total sum .

  2. Total count .

  3. Average .

  4. Trap: the partition averages are 30, 10 and 10, and their mean is not the overall average, because the counts differ.

PRACTICE 52 marks · NAT

A cube has three dimensions with 10, 5 and 4 distinct values at their lowest levels and no concept hierarchies. A cell is a choice, for each dimension, of one of its values or the single value 'all'. Assuming every such combination is a non-empty cell, how many cells does the whole cube (all cuboids together) contain?

Answer and solution

Answer:

  1. Each dimension contributes options: 11, 6, 5.

  2. Total cells .

  3. Check: the base cuboid alone has cells, the rest are aggregate cells.

PRACTICE 61 mark · MCQ

In SQL, how many groupings (including the grand total) does GROUP BY ROLLUP (a, b, c) compute?

  1. (A)

    3

  2. (B)

    4

  3. (C)

    6

  4. (D)

    8

Answer and solution

Answer: (B)

  1. ROLLUP drops columns from the right one at a time.

  2. Groupings: , , , .

  3. That is ; CUBE on the same three columns would give .

OFFICIAL GATE 2027 SYLLABUS WORDING

Copied from the GATE 2027 syllabus; see all 2027 syllabi.

GATE DA

data warehouse modelling: schema for multidimensional data models, concept hierarchies, measures: categorization and computations

Preparing in Kolkata? IAE Academy's course for GATE DA.