
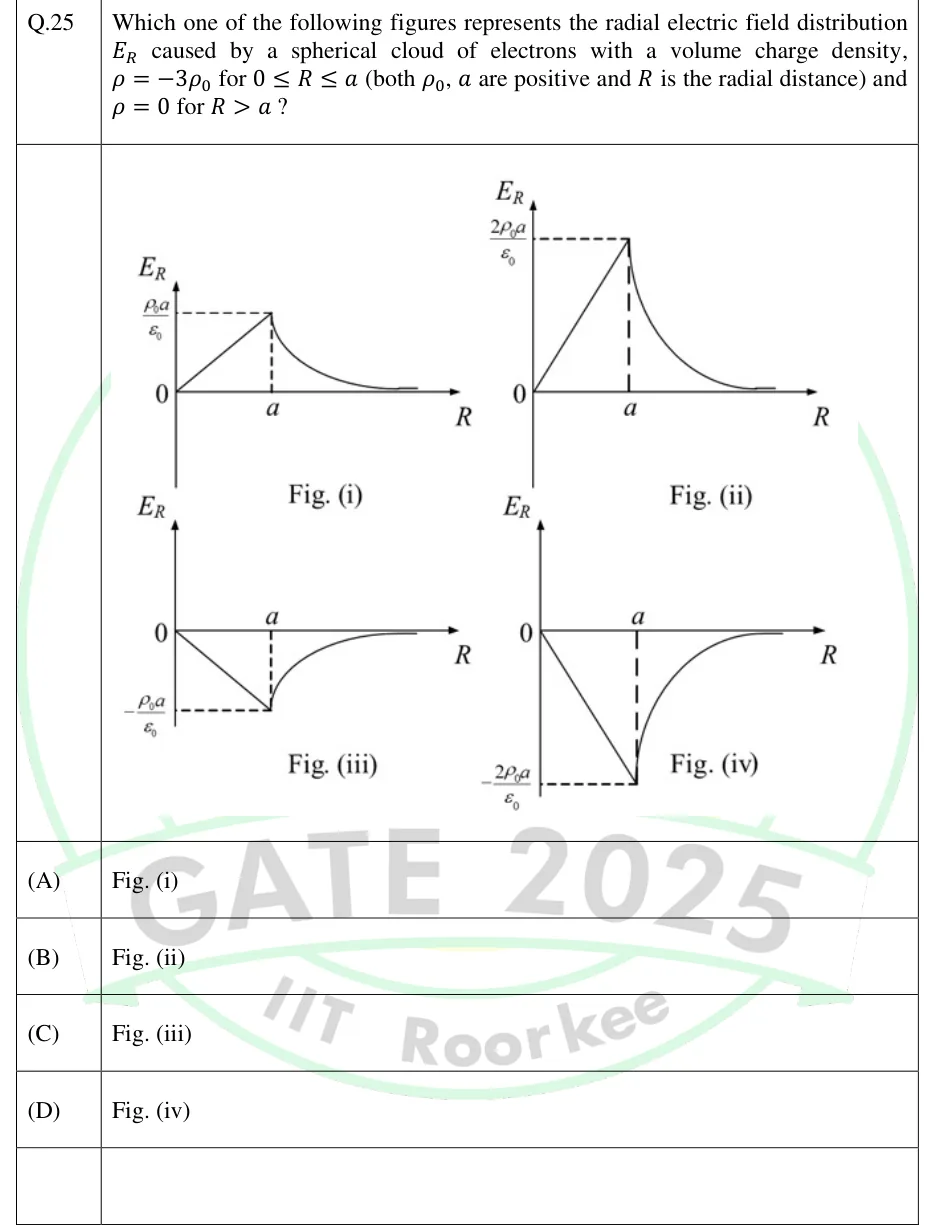
Which one of the following figures represents the radial electric field distribution caused by a spherical cloud of electrons with a volume charge density, for (both , are positive and is the radial distance) and for ?
 Tap to open full size
Figure description
Four sketches, each plotting E_R (vertical axis) against R (horizontal axis), origin marked 0, with a dashed vertical line at R = a. Fig. (i): E_R rises linearly from 0 at R = 0 to a positive peak ρ_0 a/ ε_0 at R = a (dashed horizontal line to the E_R axis marks this value). For R > a it decays along a curve towards zero. Fig. (ii): same shape as Fig. (i), but the positive peak at R = a is labelled 2 ρ_0 a/ ε_0 and the linear rise is steeper. Fig. (iii): E_R falls linearly from 0 at R = 0 to a negative minimum - ρ_0 a/ ε_0 at R = a (dashed horizontal line marks this value). For R > a it rises along a curve back towards zero from below. Fig. (iv): same shape as Fig. (iii), but the negative minimum at R = a is labelled -2 ρ_0 a/ ε_0 and the linear fall is steeper.
- (A)
Fig. (i)
- (B)
Fig. (ii)
- (C)
Fig. (iii)
- (D)
Fig. (iv)