
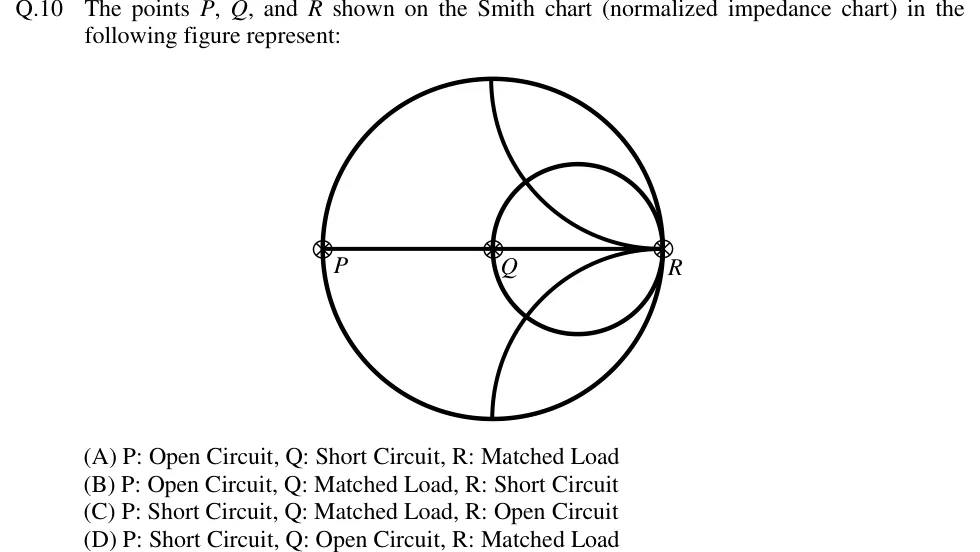
The points , , and shown on the Smith chart (normalized impedance chart) in the following figure represent:
 Tap to open full size
Figure description
A normalized-impedance Smith chart drawn in outline. The outer unit circle (| Γ | = 1) is shown, with a horizontal diameter (the real axis, x = 0) running from the leftmost point to the rightmost point. A smaller circle passes through the chart centre and the rightmost point (the r = 1 constant-resistance circle). Two arcs run from the top and bottom of the outer circle to the rightmost point (the x = +1 arc in the upper half and the x = -1 arc in the lower half). Three points are marked with a circled cross: P at the leftmost end of the horizontal diameter, Q at the centre of the chart (where the r = 1 circle meets the real axis on its left side), and R at the rightmost end of the horizontal diameter, where all the circles and arcs meet.
- (A)
P: Open Circuit, Q: Short Circuit, R: Matched Load
- (B)
P: Open Circuit, Q: Matched Load, R: Short Circuit
- (C)
P: Short Circuit, Q: Matched Load, R: Open Circuit
- (D)
P: Short Circuit, Q: Open Circuit, R: Matched Load