
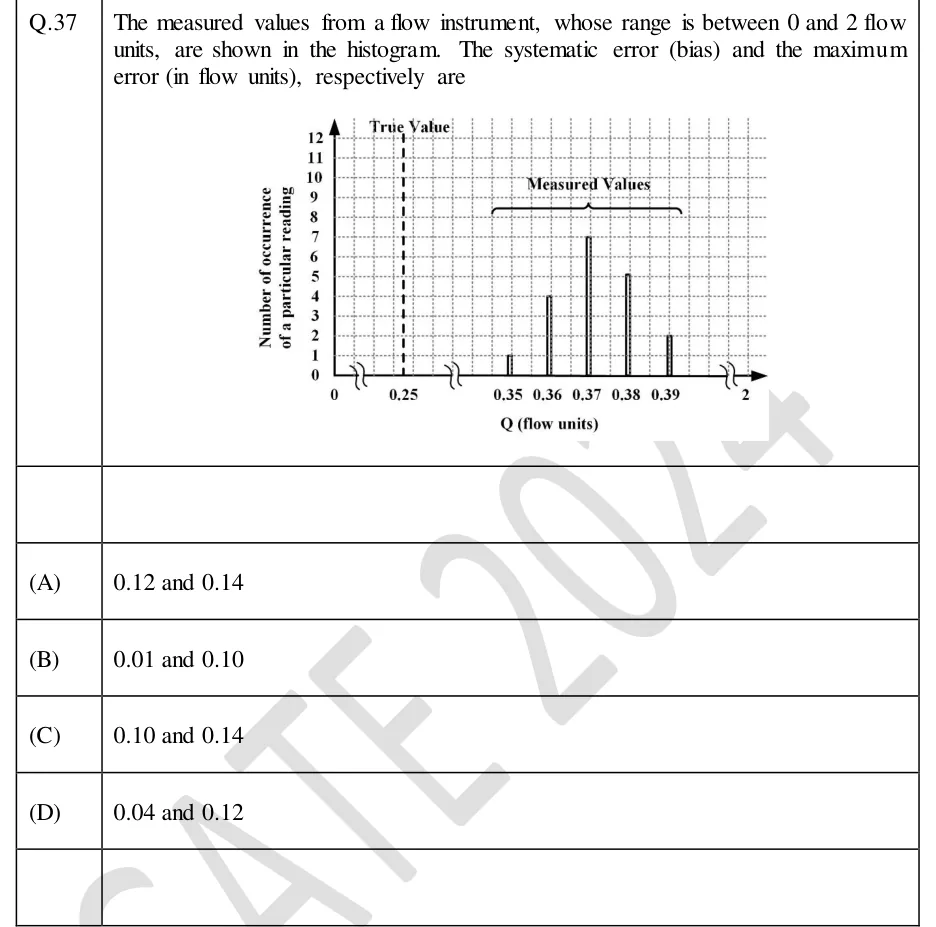
The measured values from a flow instrument, whose range is between 0 and 2 flow units, are shown in the histogram. The systematic error (bias) and the maximum error (in flow units), respectively are
 Tap to open full size
Figure description
Histogram on a dotted grid. Horizontal axis: Q (flow units), with ticks labelled 0, 0.25, 0.35, 0.36, 0.37, 0.38, 0.39 and 2, and axis-break symbols between 0 and 0.25, between 0.25 and 0.35, and between 0.39 and 2. Vertical axis: 'Number of occurrence of a particular reading', from 0 to 12 in steps of 1. A vertical dashed line at Q = 0.25 is labelled 'True Value'. Narrow bars, grouped under a brace labelled 'Measured Values': Q = 0.35 has height 1, Q = 0.36 has height 4, Q = 0.37 has height 7, Q = 0.38 has height 5, Q = 0.39 has height 2 (19 readings in total).
- (A)
0.12 and 0.14
- (B)
0.01 and 0.10
- (C)
0.10 and 0.14
- (D)
0.04 and 0.12