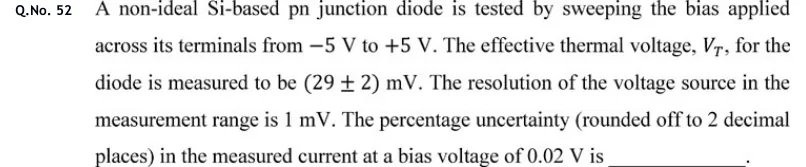
GATE 2026 IN Q.29
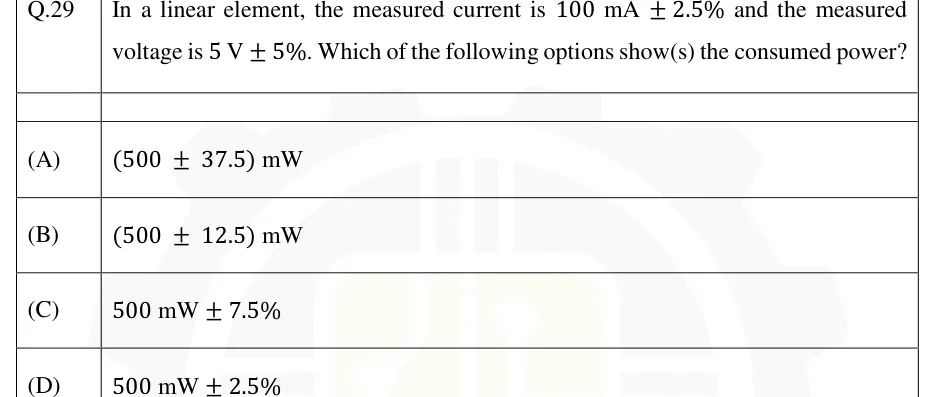
In a linear element, the measured current is and the measured voltage is . Which of the following options show(s) the consumed power?
- (A)
- (B)
- (C)
- (D)

GATE EE · IN
This topic is the working language of every measurement question: how an instrument's steady-state performance is described, how errors are classified, how the guaranteed (limiting) error of each reading carries into a computed result, and how the scatter of repeated readings is reduced to a mean, a standard deviation and a stated uncertainty. It also covers the SI units and standards that electrical measurements are traced to, and fitting a calibration line by least squares. The calculations are short; the real difficulty is using the right convention: percentage of true value or of full scale, worst-case or root-sum-square combination, or .
11 previous-year questions · 11 solved · 7 practice questions
A measurement compares an unknown quantity with a standard. The true value is what a perfect instrument would read; in practice it is the value given by a standard of much smaller uncertainty (the conventional true value). The measured value is what the instrument shows. Static characteristics describe the instrument when the input is steady; how it follows a changing input (speed of response, lag, fidelity) is a separate, dynamic matter.
Accuracy and precision are different properties. Accuracy is closeness of a reading to the true value. Precision is closeness of repeated readings to one another, whatever the true value. An instrument with a zero offset can be very precise (readings tightly grouped) and still inaccurate (the whole group sits away from the true value). An instrument that is to be accurate on every reading needs both small scatter and small bias, so precision alone does not guarantee accuracy.
Characteristic | Meaning | Usually expressed as |
|---|---|---|
Accuracy | Closeness of a reading to the true value | % of true value, of reading, or of full scale |
Precision (repeatability, reproducibility) | Closeness of repeated readings of the same quantity to each other: under unchanged conditions (repeatability), or with a changed observer, instrument, method, place or time (reproducibility) | Spread of the readings, e.g. standard deviation |
Resolution | Smallest change in input that produces a detectable change in output | A fraction of a scale division (analogue) or one count (digital) |
Sensitivity | Change in steady output per unit change in input | e.g. mm per A, divisions per mV |
Threshold | Smallest input, starting from zero, that gives a detectable output | Input units |
Dead zone (dead band) | Largest range of input change to which the instrument does not respond | Input units |
Linearity | Largest deviation of the calibration curve from a specified straight line (best-fit, or through the end points) | % of full scale |
Hysteresis | Different outputs for the same input depending on whether the input is rising or falling | % of full scale |
Drift | Slow change of output with time at constant input (zero drift, span drift) | Units per hour or per C |
STATIC (ABSOLUTE) ERROR AND CORRECTION
Sign convention used throughout these notes: error = measured minus true, so a positive error means the instrument reads high. The correction is what must be added to the reading to get the true value. Some texts define the error with the opposite sign; check the convention a question uses.
RELATIVE (FRACTIONAL) ERROR
Taken relative to the true value unless the question says otherwise. When the error is small, dividing by instead changes the result only in the second order. An accuracy quoted as a percentage of full scale is a different quantity (see limiting errors).
RELATIVE ACCURACY
Accuracy is the complement of the relative error: a reading 2% in error is 98% accurate.
PRECISION OF ONE OF A SET OF READINGS
How far the -th of a set of repeated readings lies from the mean of the set. It says nothing about the true value.
STATIC SENSITIVITY AND DEFLECTION FACTOR
Change in steady output per change in input ; for a linear instrument, the slope of its calibration line. The unit combines output and input units.
EXAM TIP
For elements in cascade (transducer, amplifier, indicator), the overall static sensitivity is the product of the individual sensitivities, , provided no stage loads the one before it.
EXAM TIP
An error of V means the correction is V. When a question gives a correction and asks for the error, or the other way round, flip the sign.
EXAM TIP
Resolution is not accuracy. A -digit display (three full digits 0 to 9 and a leading digit that can only be 0 or 1, so a maximum of 1999 counts) resolves 1 mV on its 2 V range, yet its accuracy may be only of reading plus a few counts.
Errors fall into three classes. Gross errors are human blunders: reading the wrong scale, recording 21.5 as 25.1, using the wrong range, connecting the instrument wrongly. They cannot be treated mathematically; they are avoided by care and caught by repeating readings, preferably by a different observer or method.
Systematic errors have the same sign and size every time the measurement is repeated under the same conditions, so repetition does not reveal them and averaging does not reduce them. They limit the accuracy. Random errors vary unpredictably from reading to reading with no identifiable cause for each; they limit the precision and are handled statistically.
Class | Cause | Examples | How it is reduced |
|---|---|---|---|
Gross | Human mistakes | Misreading, wrong range, transcription slip, wrong connection | Care; repeated readings; cross-checks. Faulty readings are discarded, not averaged |
Systematic: instrumental | Defects or limitations of the instrument itself | Zero offset, calibration (scale-factor) error, friction, worn parts, loading of the circuit | Calibration against a standard, correction factors, zero adjustment, a better method |
Systematic: environmental | Conditions outside the instrument | Temperature, humidity, stray magnetic and electric fields, vibration | Controlled conditions, shielding, compensation |
Systematic: observational | The way the reading is taken | Parallax, consistent bias in estimating fractions of a division | Mirror-backed scale, digital readout, fixed procedure |
Random | Many small, unidentified, fluctuating causes | Noise, small fluctuations that remain after all known errors are removed | Averaging many readings; statistical treatment |
Loading is a systematic error: an instrument that draws power from the circuit changes the quantity it measures. It is always in the same direction and, when the resistance of the circuit at the measuring point is known, it can be calculated and corrected.
VOLTMETER LOADING ERROR
Voltmeter of resistance across a source of open-circuit (Thevenin) voltage and internal (Thevenin) resistance . The error is always negative (the meter reads low) and shrinks as grows. For a PMMC voltmeter, = (ohms-per-volt sensitivity) (range in use), where ohms-per-volt , the reciprocal of the full-scale current.
AMMETER INSERTION (LOADING) ERROR
Ammeter of resistance inserted in a branch; is the current before insertion and the Thevenin resistance of the circuit seen from the break. The ammeter always reads low; the error is small when .
EXAM TIP
Averaging independent readings divides the standard deviation of the mean by but leaves a systematic error untouched. A zero offset, calibration error or loading error has to be removed by calibration, by a correction, or by a better method.
EXAM TIP
A systematic error need not be a constant offset. A scale-factor (gain) error grows in proportion to the reading. Calibrating at two or more points separates the two: the offset is the intercept of the calibration line and the gain error is the departure of its slope from the ideal value (1 for an instrument meant to read the input directly).
Manufacturers state the accuracy of components and instruments as a limiting (guarantee) error: a bound that the deviation will not exceed. A resistor marked lies somewhere between 99 and . For a component the limit is a percentage of the nominal (specified) value. For an analogue instrument it is usually a percentage of the full-scale value, so the absolute limit is the same everywhere on the scale and the error as a fraction of the reading grows as the reading falls.
When a result is computed from several quantities, each with a limiting error, the limiting error of the result is the worst case: every input is taken at the edge of its band in the direction that moves the result furthest. That is why the rules below always add magnitudes, for differences and quotients as well as sums and products. The rules are first-order (linearised), which is accurate when the errors are small.
LIMITING ERROR OF A COMPONENT OR READING
= nominal or specified value, = guaranteed bound, = actual value, which can lie anywhere in the band.
FULL-SCALE SPECIFICATION: LIMITING ERROR AT A READING
For an accuracy quoted as a fraction of the full-scale value . At half scale the relative limiting error is twice the quoted figure; at one-tenth scale, ten times. Hence the range is chosen so that the reading falls in the upper part of the scale. A specification as a percentage of span uses the span (upper minus lower range value) in place of ; the two differ only for a range that does not start at zero.
SUM OR DIFFERENCE
Absolute limiting errors add, for a difference as well as a sum. For a difference, is small when , so the relative error can be very large.
PRODUCT OR QUOTIENT
Relative limiting errors add, for a quotient as well as a product.
POWERS (GENERAL PRODUCT FORM)
Each relative error is weighted by the magnitude of its exponent, whether positive, negative or fractional ( is an exact constant). gives ; gives .
GENERAL FUNCTION (WORST CASE)
Linearised, so valid for small errors. Use it whenever a variable appears more than once, as in : applying the product and sum rules separately treats the two appearances as independent, which can only overstate the error, never understate it.
WORKED EXAMPLE
The resistance of a resistor is found from simultaneous voltmeter and ammeter readings. The voltmeter (range 0 to 300 V, guaranteed accuracy of full scale) reads 120 V; the ammeter (range 0 to 5 A, of full scale) reads 2.4 A. Neglecting meter loading, find (a) the limiting error of as a percentage and in ohms, and (b) the root-sum-square combination of the two relative errors, the estimate used when the two errors are independent and unlikely to be at their extremes together.
Voltmeter: V at any reading, so at 120 V the relative limiting error is .
Ammeter: A, so at 2.4 A it is .
.
Quotient rule: , so .
Root-sum-square: , i.e. .
Note that both meters are specified far better than the 2.5% and 1.04% that apply at these readings, because neither reading is near full scale.
Answer: ; limiting error (, so lies between 48.23 and ); root-sum-square estimate ().
EXAM TIP
Small differences magnify error. With and , : a 40% limiting error from two 1% readings. Any method that finds a quantity as the small difference of two large readings is inherently inaccurate.
EXAM TIP
Digital specifications of the form (p% of reading + N digits) mean: error = p% of the reading plus N times the value of the last displayed digit on the range in use. A -digit meter on its 2 V range (last digit = 1 mV), specified (0.5% of reading + 1 digit), reading 0.500 V: error mV, which is 0.7% of the reading.
EXAM TIP
For the log-derivative gives , a weighted average of the two relative errors, so a parallel combination is never worse (in relative terms) than its worse component. A series combination is also a weighted average, with weights and .
When a steady quantity is measured many times after all known systematic errors have been removed, the readings still scatter because of random error. The scatter of a large set is commonly modelled by the normal (Gaussian) distribution centred on the mean. The best estimate of the quantity is the arithmetic mean; the spread is described through the deviations of the readings from it.
ARITHMETIC MEAN AND DEVIATION
The deviations from the mean always sum to zero, a useful arithmetic check.
AVERAGE DEVIATION
Magnitudes are needed because the signed deviations cancel. For a large normally distributed set, .
STANDARD DEVIATION AND VARIANCE
(divide by ) describes a whole population or a very large set. (divide by ) is the estimate from a finite sample, because one degree of freedom is used up in computing ; the difference matters only when is small. Use the one the question asks for.
NORMAL (GAUSSIAN) DISTRIBUTION
Probability density of a reading about the mean . is the precision index: the larger , the sharper the curve and the more precise the readings.
PROBABLE ERROR
Half of a large set of normally distributed readings lie within . Use the same or that the question specifies.
STANDARD DEVIATION OF THE MEAN
Scatter of the mean of independent readings, each of standard deviation . Quadrupling the number of readings halves it; it does nothing to systematic error.
Interval about the mean (normal distribution) | Fraction of readings inside |
|---|---|
(probable error) | 50% |
68.27% | |
95% | |
95.45% | |
99.73% |
WORKED EXAMPLE
Five readings of a resistance, taken with the same bridge under the same conditions, are 101.2, 101.6, 100.8, 101.0 and . Find the mean, the average deviation, the standard deviation (with ), the probable error of one reading and the Type A standard uncertainty of the mean, and write the result with an expanded uncertainty for .
.
Deviations: ; they sum to zero, as they must.
Average deviation: .
, so . (Dividing by would give .)
Probable error of one reading: .
Type A standard uncertainty of the mean: ; expanded uncertainty , rounded to .
With only 4 degrees of freedom, covers only about 88%; a strict 95% interval uses the t-distribution factor 2.78 for 4 degrees of freedom, giving .
Answer: , , , , ; result ().
EXAM TIP
The two standard deviations differ by the factor : 11.8% for and 5.4% for . That is enough to separate answer options, so read whether the question wants division by or by .
EXAM TIP
For a normal distribution, , and are the same scatter at 50%, about 68% and about 95% confidence, so converting between them is multiplication by a constant. Check also whether the question is about one reading (use ) or about the mean of readings (use ); an expanded uncertainty is normally stated for the mean.
A result is incomplete without a statement of how far it may lie from the true value. The uncertainty of a measurement is a parameter describing the spread of values that could reasonably be attributed to the measured quantity. Each source is first expressed as a standard uncertainty (one standard deviation), evaluated in one of two ways. Type A is statistical, from repeated readings. Type B is by other means: a calibration certificate, a manufacturer's specification, the resolution of a display, handbook data. The standard uncertainties are combined by root-sum-square into the combined standard uncertainty , which is multiplied by a coverage factor to give the expanded uncertainty .
TYPE A STANDARD UNCERTAINTY (MEAN OF REPEATED READINGS)
is the sample standard deviation (with ) of the readings.
TYPE B STANDARD UNCERTAINTY
are the limits. Rectangular when any value within the limits is equally likely (a tolerance with no further information); a display of resolution gives , so . A certificate quoting at coverage factor gives .
COMBINED STANDARD UNCERTAINTY
For with uncorrelated inputs. is the sensitivity coefficient of input . The same root-sum-square rule propagates the standard deviations, or the probable errors, of independent quantities: and .
RELATIVE COMBINED UNCERTAINTY FOR A PRODUCT FORM
The statistical counterpart of the power rule for limiting errors: relative uncertainties weighted by the exponents, squared, added, square-rooted.
EXPANDED UNCERTAINTY AND THE REPORTED RESULT
gives about 95% coverage and about 99.7% when the combined distribution is close to normal with many degrees of freedom. State with the result.
Aspect | Limiting (worst-case) error | Statistical (root-sum-square) uncertainty |
|---|---|---|
How errors combine | Magnitudes added | Squares added, then square root |
Sum or difference | ||
Product or quotient | ||
What the number means | A bound (to first order, for small errors) that is not exceeded while every input is within its limit | A standard deviation: exceeded with a known probability |
Use when the question says | Limiting, guaranteed, maximum or worst-case error | Standard deviation, standard uncertainty, probable or rms error, with independent inputs |
Size | Larger, for the same input figures | Never larger than the linear sum of the same input figures |
Writing a result with its uncertainty
Correct the readings for every known systematic error (offset, calibration, loading).
Take the mean of the repeated readings; its Type A standard uncertainty is .
List every other source (calibration of the standard, resolution, temperature, and so on) and convert each to a standard uncertainty (Type B).
Multiply each standard uncertainty by its sensitivity coefficient and combine by root-sum-square to get .
Choose the coverage factor (usually ) and compute .
Round to one or two significant figures, round the result to the same decimal place, and write value , unit and : for example ().
EXAM TIP
Significant figures: in a sum or difference, keep the decimal place of the least precise term (); in a product or quotient, keep the number of significant figures of the least precise factor (). Round only the final answer, not intermediate steps.
EXAM TIP
If a question gives limiting errors and asks for the error of a computed result, add the magnitudes. Use root-sum-square only when it says standard deviations, standard uncertainties or probable errors, or explicitly asks for a statistical combination of independent errors.
The SI has seven base units: metre (m), kilogram (kg), second (s), ampere (A), kelvin (K), mole (mol) and candela (cd). Since the 2019 revision the units are defined through seven defining constants whose numerical values are fixed exactly. For electrical work the relevant constants are the caesium-133 hyperfine frequency Hz (defines the second), the speed of light m/s (with the second, defines the metre), the Planck constant J s and the elementary charge C. Fixing defines the ampere: a current of one ampere is a flow of , about , elementary charges per second.
Quantity | Unit (symbol) | Defined as | In SI base units |
|---|---|---|---|
Electric charge | coulomb (C) | A s | |
Potential difference, emf | volt (V) | W/A | |
Resistance | ohm () | V/A | |
Conductance | siemens (S) | A/V | |
Capacitance | farad (F) | C/V | |
Inductance | henry (H) | Wb/A | |
Magnetic flux | weber (Wb) | V s | |
Magnetic flux density | tesla (T) | Wb/m | |
Frequency | hertz (Hz) | 1/s | |
Power | watt (W) | J/s | |
Energy | joule (J) | N m |
Hierarchy of standards (most accurate first)
International standards: agreed internationally and used to compare the national realisations of each unit. Not available for routine calibration.
Primary standards: maintained by national standards laboratories, realised absolutely (today mostly by quantum effects); used to calibrate secondary standards.
Secondary standards: reference standards of industrial and calibration laboratories, periodically recalibrated against the primary standards.
Working standards: used day to day in the laboratory to check and calibrate instruments.
Traceability is the unbroken chain of calibrations linking a working instrument to the primary standard, each step with a stated uncertainty. Uncertainty can only grow down the chain.
Quantity | Primary (absolute or quantum) realisation | Secondary and working standards |
|---|---|---|
Frequency and time | Caesium-133 hyperfine transition, Hz, which defines the second (caesium beam and fountain clocks) | Hydrogen masers, rubidium standards, GPS-disciplined and oven-controlled quartz oscillators |
Voltage | Josephson junction arrays: , fixed by a frequency and fundamental constants | Zener-diode reference standards (1 V, 10 V). The saturated cadmium standard cell (about 1.0186 V at 20 C) is historical; it must not be loaded, because drawing appreciable current changes its emf, so it is read only by a null (potentiometer) method |
Resistance | Quantum Hall effect: | Manganin (Cu-Mn-Ni) wire resistors: low temperature coefficient and low thermo-emf against copper, bifilar wound to cut inductance, four-terminal for low values, kept at controlled temperature |
Current | No separate artefact: realised from the volt and the ohm by Ohm's law, ; very small currents by single-electron pumps, | A standard resistor with a voltage standard (potentiometer and shunt) |
Capacitance | Calculable cross capacitor (depends only on and a length), or traced to the quantum Hall resistance through AC bridges | Fused-silica, air-dielectric and mica capacitors in sealed, temperature-controlled enclosures |
Inductance | Derived from resistance and capacitance standards through AC bridges (a bridge balance gives as a product of the form ) | Self and mutual inductors wound on stable, non-magnetic formers (marble, ceramic) |
JOSEPHSON VOLTAGE STANDARD
A junction irradiated at microwave frequency shows constant-voltage steps at integer , each high: about V per GHz. Since 2019 is exact. junctions in series, each on step , give ; arrays of thousands of junctions give 1 V and 10 V.
QUANTUM HALL RESISTANCE STANDARD
In a two-dimensional electron gas at low temperature and high magnetic field, the Hall resistance takes plateau values for integer , independent of the sample's dimensions and material. The plateau, , is commonly used.
CALCULABLE CROSS CAPACITOR
Cross capacitance per unit length of a symmetric four-electrode arrangement; only a length has to be measured, so capacitance is realised absolutely.
EXAM TIP
Unit checks catch slips: , and are in seconds, is in ohms, and .
EXAM TIP
Before 2019 the ampere was defined by force: the constant current which, in two straight parallel conductors of infinite length and negligible cross-section placed 1 m apart in vacuum, produces between them a force of N per metre of length. That definition made exactly H/m.
EXAM TIP
Since 2019 is a measured constant rather than exactly H/m, but it agrees with that value to better than one part in , so use H/m in calculations.
Calibration gives pairs : from a standard and the instrument's response. The least-squares straight line minimises the sum of squared vertical residuals . This assumes the errors are in only and is exact (or far more accurate), so the less certain quantity goes on the axis. The fitted slope is the instrument's sensitivity, the intercept its zero offset, and the largest residual as a percentage of full scale is a common measure of non-linearity.
When the points are not equally reliable, each is given a weight , where is the standard deviation of , and the weighted sum is minimised. A point with half the standard deviation carries four times the weight. With all weights equal, the weighted formulas reduce to the ordinary ones.
LEAST-SQUARES STRAIGHT LINE (UNWEIGHTED)
Every point equally reliable. The line passes through the centroid and the residuals sum to zero.
SLOPE IN DEVIATION FORM
Same slope as above with smaller numbers. and .
LINE THROUGH THE ORIGIN
Only when the model is known to have zero intercept. This line does not in general pass through the centroid.
CORRELATION COEFFICIENT
. close to 1 means the points lie close to a straight line; it does not show that a straight line is the right model.
STANDARD ERRORS OF THE UNWEIGHTED FIT
because two parameters have been fitted from the data.
WEIGHTED LEAST-SQUARES STRAIGHT LINE
The line passes through the weighted centroid .
UNCERTAINTIES OF THE WEIGHTED FIT
Valid when the used in the weights are the true standard deviations of the .
WEIGHTED MEAN
Combines independent measurements of the same quantity made with different precision. The combined uncertainty is smaller than the smallest individual one; with equal it reduces to and .
WORKED EXAMPLE
A voltmeter is calibrated against a standard. Standard inputs = 0, 1, 2, 3 and 4 V give readings = 0.1, 1.1, 1.9, 3.2 and 3.9 V. Fit by least squares (treating as exact), find the residuals, and find the true input when the meter reads 2.52 V.
, , , , .
.
, , so V.
Fitted values 0.10, 1.07, 2.04, 3.01, 3.98 V; residuals V, which sum to zero. The largest, 0.19 V, is 4.75% of the 4 V span.
Inverting the calibration: V.
Answer: (V): zero offset V and sensitivity 0.97 (a gain error of ). A reading of 2.52 V corresponds to a true input of 2.495 V.
EXAM TIP
Centroid check: the unweighted least-squares line always passes through . In a multiple-choice question, put into each option; any line that does not return is wrong before any slope is computed. The line joining the two end points is not, in general, the least-squares line.
EXAM TIP
Weighted mean in one line: readings V and V (standard deviations) have weights in the ratio , so V, with V.
PREVIOUS-YEAR QUESTIONS
Try each question first, then open the answer. We placed each question under a topic ourselves; the exam paper does not label topics.
See these papers in full: GATE EE 2025 · GATE EE 2022 · GATE EE 2020 · GATE IN 2026 · GATE IN 2025 · GATE IN 2024 · GATE IN 2020 · GATE IN 2018
In a linear element, the measured current is and the measured voltage is . Which of the following options show(s) the consumed power?
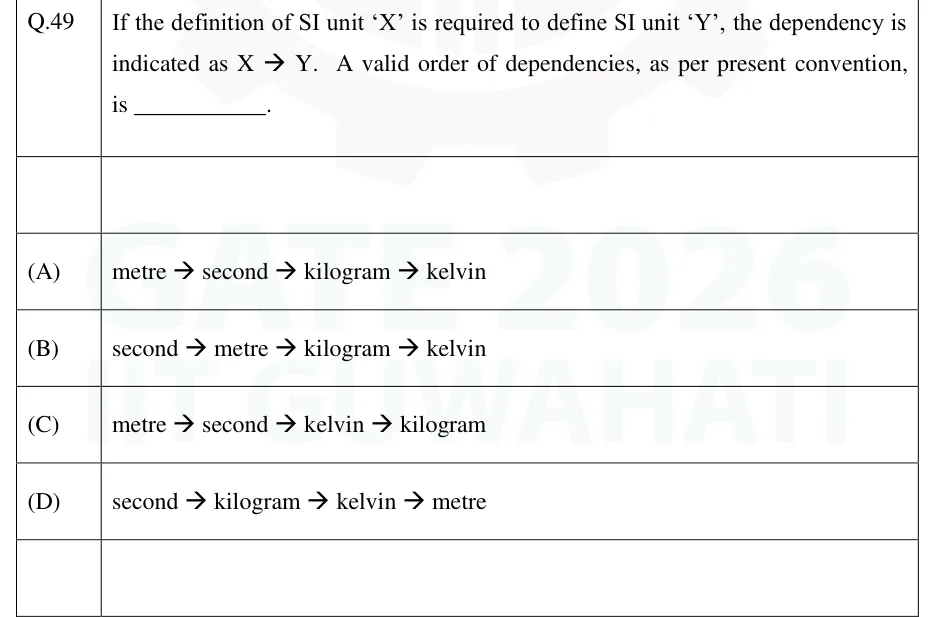
If the definition of SI unit 'X' is required to define SI unit 'Y', the dependency is indicated as X → Y. A valid order of dependencies, as per present convention, is ____________.
metre → second → kilogram → kelvin
second → metre → kilogram → kelvin
metre → second → kelvin → kilogram
second → kilogram → kelvin → metre
The maximum percentage error in the equivalent resistance of two parallel-connected resistors of and with each having a maximum error is ________ (round off to nearest integer value).
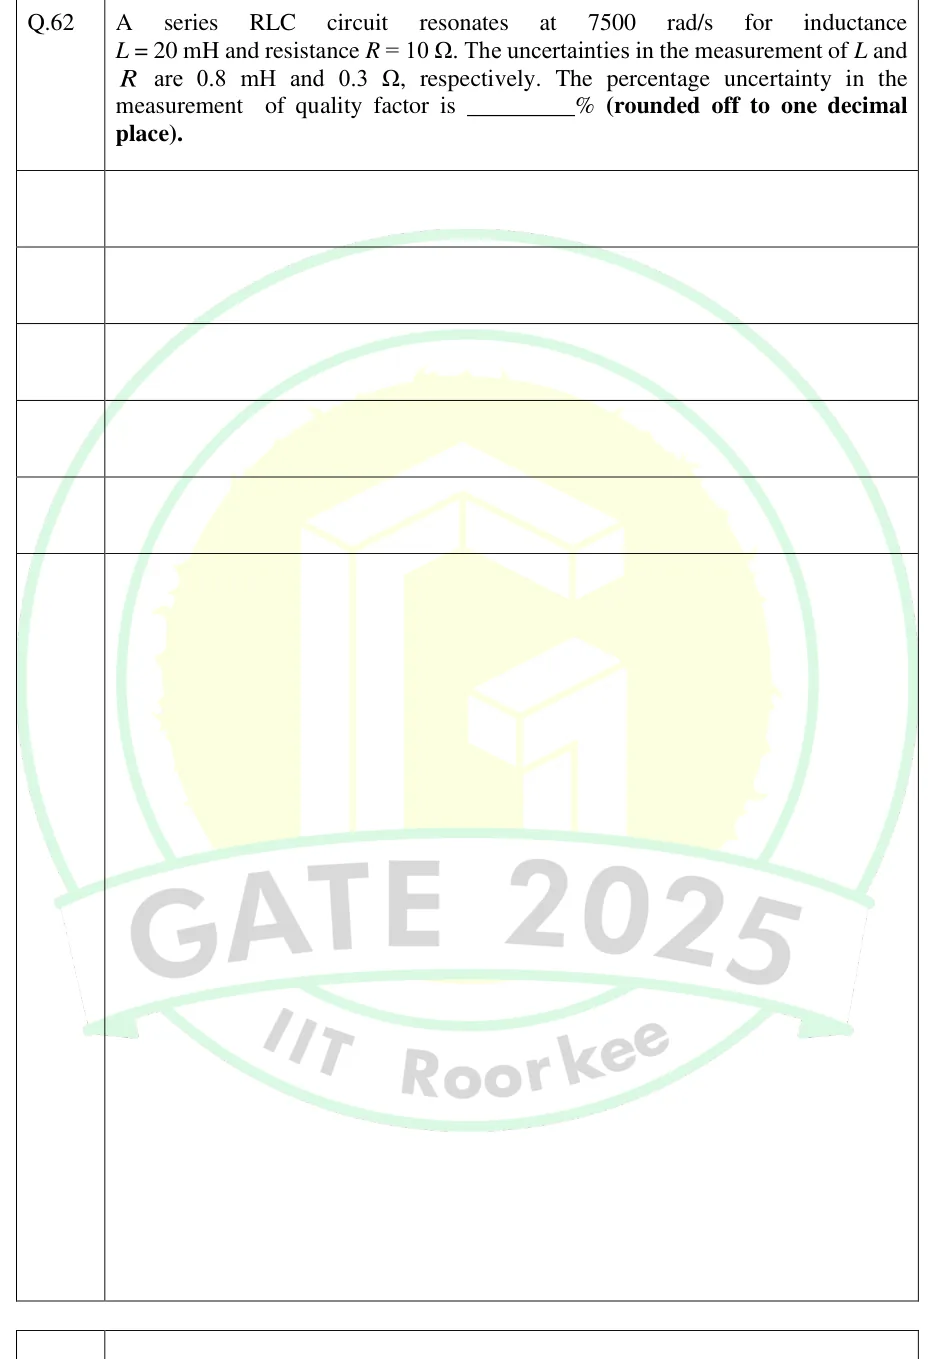
A series RLC circuit resonates at 7500 rad/s for inductance and resistance . The uncertainties in the measurement of and are and , respectively. The percentage uncertainty in the measurement of quality factor is ________ % (rounded off to one decimal place).
The resistance of a 20 k resistor is measured six consecutive times using an LCR meter. The first five readings are 19 k, 18 k, 23 k, 21 k and 17 k. If the mean of the measurements and the true value are equal, the last reading is ________ k (rounded off to nearest integer).
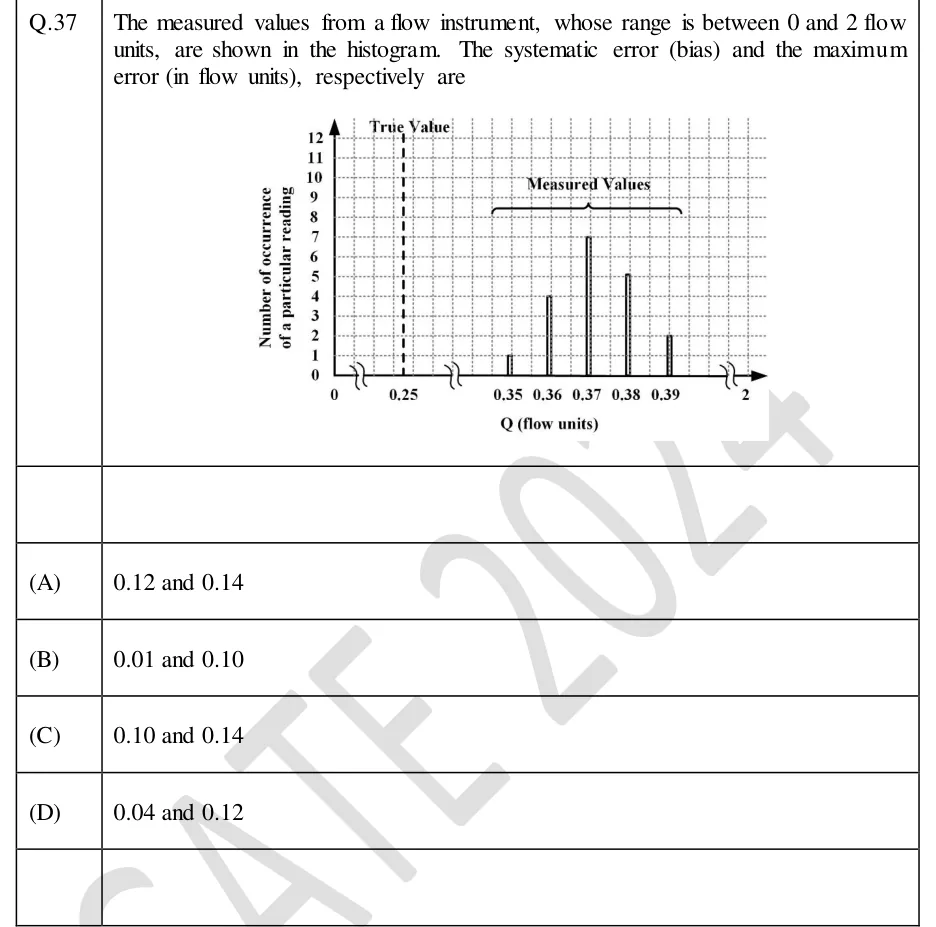
The measured values from a flow instrument, whose range is between 0 and 2 flow units, are shown in the histogram. The systematic error (bias) and the maximum error (in flow units), respectively are
 Tap to open full size
Histogram on a dotted grid. Horizontal axis: Q (flow units), with ticks labelled 0, 0.25, 0.35, 0.36, 0.37, 0.38, 0.39 and 2, and axis-break symbols between 0 and 0.25, between 0.25 and 0.35, and between 0.39 and 2. Vertical axis: 'Number of occurrence of a particular reading', from 0 to 12 in steps of 1. A vertical dashed line at Q = 0.25 is labelled 'True Value'. Narrow bars, grouped under a brace labelled 'Measured Values': Q = 0.35 has height 1, Q = 0.36 has height 4, Q = 0.37 has height 7, Q = 0.38 has height 5, Q = 0.39 has height 2 (19 readings in total).
0.12 and 0.14
0.01 and 0.10
0.10 and 0.14
0.04 and 0.12
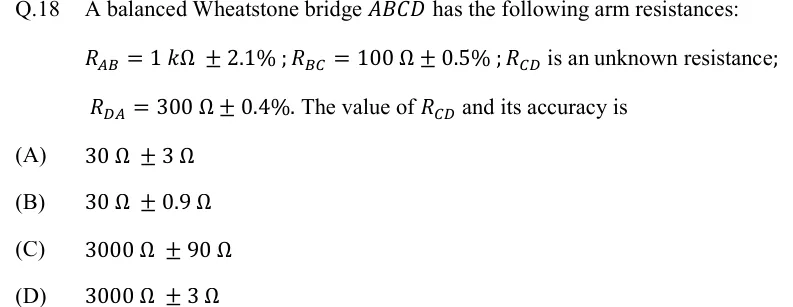
A balanced Wheatstone bridge has the following arm resistances:
; ; is an unknown resistance; . The value of and its accuracy is
Q.30 If only 5% of the supplied power to a cable reaches the output terminal, the power loss in the cable, in decibels, is ________. (round off to nearest integer)
A non-ideal Si-based pn junction diode is tested by sweeping the bias applied across its terminals from to . The effective thermal voltage, , for the diode is measured to be . The resolution of the voltage source in the measurement range is . The percentage uncertainty (rounded off to 2 decimal places) in the measured current at a bias voltage of is ________.
Two resistors having tolerance and are connected in series. The effective tolerance of the series combination (in %, rounded off to one decimal place) is ____
The voltage and current drawn by a resistive load are measured with a 300 V voltmeter of accuracy of full scale and a 5 A ammeter of accuracy of full scale. The readings obtained are 200 V and 2.5 A. The limiting error (in %) in computing the load resistance is (up to two decimal places) ____.
PRACTICE
A 0 to 150 V voltmeter has a guaranteed accuracy of of full-scale reading. When it reads 60 V, the limiting error of this reading, expressed as a percentage of the reading, is
Answer: (C)
A full-scale specification fixes the absolute limit at every point of the scale: V.
At 60 V: , i.e. of the reading.
applies only at full scale; confuses volts with per cent.
Two resistors, and (limiting errors), are connected in parallel. Using the first-order limiting-error rule, the magnitude of the limiting error of the equivalent resistance, as a percentage of its nominal value, is ______ % (round off to two decimal places).
Answer: (accepted range )
Nominal value: .
, so .
Both coefficients are positive (0.75 and 0.25), so the worst case adds: .
Check with the extremes: () and ().
Applying the product rule to and the sum rule to separately would give 4.25%, an overestimate, because and each appear twice.
Five readings of the frequency of a source are 49.8, 50.1, 50.0, 49.9 and 50.2 Hz. Using the standard deviation computed with in the denominator, the probable error of a single reading is ______ Hz (round off to three decimal places).
Answer: (accepted range )
Mean Hz.
Deviations: Hz, so .
Hz.
Probable error Hz.
Which of the following statements are correct?
Averaging independent readings reduces a systematic error by the factor .
A tolerance stated only as limits , with every value within the limits equally likely, corresponds to a standard uncertainty of .
In the quantum Hall effect the plateau resistances are for integer , independent of the sample's dimensions and material.
A Josephson junction irradiated at frequency shows voltage steps at for integer .
Answer: (B), (C)
A is false: a systematic error has the same sign and size in every reading, so averaging leaves it unchanged. Averaging reduces only random error.
B is true: a uniform distribution over has variance , so .
C is true: with , a universal value, which is why it serves as the resistance standard.
D is false: the steps are at , about V per GHz. The expression is not even a voltage; its unit is .
A transducer is calibrated at four points, given as (standard input , output ): (1, 2.9), (2, 5.1), (3, 7.0) and (4, 9.0). Treating as exact, the least-squares straight line is
Answer: (A)
, , , , .
.
.
Centroid check: only A and C return at ; C has the wrong slope. B is the line through the two end points, not the least-squares line.
A PMMC voltmeter of sensitivity , used on its 10 V range, is connected across a source of open-circuit voltage 6 V and internal resistance . Taking error as measured value minus true value, expressed as a percentage of the true (open-circuit) voltage, the error in the reading is ______ % (round off to one decimal place).
Answer: (accepted range )
Meter resistance on the 10 V range: .
Reading: .
Error: , i.e. . The same follows from .
The sign is negative because a voltmeter always loads the source and reads low.
The power dissipated in a resistor is computed as . The relative standard uncertainties are 0.5% for and 1.0% for , and the two are uncorrelated. The relative combined standard uncertainty of is ______ % (round off to two decimal places).
Answer: (accepted range )
The exponents are 2 for and for , so .
.
Adding the same figures linearly (the limiting-error rule) would give ; forgetting the exponent 2 would give .
OFFICIAL GATE 2027 SYLLABUS WORDING
Copied from the GATE 2027 syllabus; see all 2027 syllabi.
GATE EE
Error analysis
GATE IN
SI units, standards of basic electrical quantities (R, L, C, voltage, current and frequency), systematic and random errors in measurement, expression of uncertainty, accuracy and precision, propagation of errors, linear and weighted regression
Preparing in Kolkata? IAE Academy's course for GATE EE or GATE IN.