GATE 2025 BT Q.60
The percentage of light that would pass through a sample with an absorbance of 2 would be ______% . (Round off to the nearest integer)

GATE BT
Microscopy and spectroscopy answer two different questions about biological material. Microscopy shows what a structure looks like: light, dark-field, phase-contrast, fluorescence, confocal and electron microscopy differ in resolution (set by wavelength and numerical aperture) and in how they create contrast. Spectroscopy measures what a molecule is and how much is present: UV-visible absorption (Beer-Lambert law, A260/A280 purity), fluorescence (including FRET), circular dichroism (secondary structure), IR/FT-IR (bond vibrations), mass spectrometry (m/z, TOF and ESI charge states) and NMR (nuclear spin, chemical shift, structure in solution). The key skills are matching each technique to its physical principle, choosing the right technique for an experimental need, and applying the standard quantitative relations with their conditions stated.
8 previous-year questions · 8 solved · 7 practice questions
Recombinant DNA work constantly needs two kinds of information: what a cell or molecule looks like (microscopy) and what it is made of or how much of it there is (spectroscopy). For each technique, know the physical principle it rests on — resolution and contrast for microscopy; the interaction of a molecule with electromagnetic radiation (or, for mass spectrometry, the behaviour of ions in electric and magnetic fields) for spectroscopy — and the standard quantitative relations (Rayleigh resolution, Beer–Lambert law, TOF and ESI mass relations, FRET distance law) that turn given data into a result.
Magnification is how much larger the image appears than the object; in a compound light microscope the total magnification is the objective magnification multiplied by the eyepiece magnification (e.g. objective with a eyepiece gives ). Resolution is the minimum distance between two points at which they can still be seen as separate. Beyond the resolution limit, further magnification only enlarges blur and reveals no new detail (empty magnification) — magnification and resolution are not the same thing.
MINIMUM RESOLVABLE DISTANCE (RAYLEIGH CRITERION)
= minimum resolvable distance (same unit as ); = wavelength of the illumination; = numerical aperture of the objective, where is the refractive index of the medium between specimen and objective (air , immersion oil ) and is the half-angle of the cone of light the objective accepts. Smaller = better resolution. Shorter wavelength and/or higher NA improve resolution; oil immersion raises NA (to about 1.4–1.5).
ABBE DIFFRACTION LIMIT (ALTERNATIVE FORM)
Abbe's form gives a slightly smaller than the Rayleigh form for the same and NA. The two are different criteria, not different conventions for the same number — use the form the question specifies.
WAVELENGTH OF AN ELECTRON (DE BROGLIE RELATION)
= Planck's constant; = momentum of the electron. A higher accelerating voltage gives the electron more momentum and hence a shorter wavelength; at typical TEM voltages (around 100 kV) the electron wavelength is a few picometres, far shorter than visible light (about 400–700 nm). This is why electron microscopes resolve far finer detail than light microscopes.
WORKED EXAMPLE
Using the Rayleigh criterion, find the minimum resolvable distance for green light of wavelength 500 nm and an oil-immersion objective of numerical aperture 1.25.
Rayleigh criterion:
Answer: (about 0.24 µm)
EXAM TIP
A smaller value of means BETTER resolution — a common sign-trap. Orders of magnitude: light microscopy about 200 nm (0.2 µm); TEM has an instrumental limit of about 0.1–0.2 nm, but for conventionally stained biological sections the practical resolution is a few nm, limited by the specimen rather than the optics; SEM resolution is lower than TEM (nanometre range).
Technique | Contrast mechanism | Sample requirement | Typical use |
|---|---|---|---|
Bright-field | Differential absorption of transmitted light by stained or pigmented structures; specimen appears dark on a bright background | Usually needs staining; live unstained cells show poor contrast | General morphology, stained smears (e.g. Gram stain) |
Dark-field | A central stop blocks the direct light; only light scattered by the specimen enters the objective, so the specimen appears bright on a dark background | Works on live, unstained specimens | Very thin or small unstained organisms (e.g. spirochaetes), motility |
Phase-contrast | An annular diaphragm and a phase ring convert phase shifts (caused by differences in refractive index and thickness) into visible differences in brightness | Works on live, unstained, transparent cells | Observing live cells and internal structures without staining |
Fluorescence | A fluorophore (dye or tag such as GFP) absorbs light at one wavelength and emits at a longer wavelength; only the emitted light is imaged, against a dark background | Requires a fluorescent label (intrinsic, or attached, e.g. antibody–dye conjugate, GFP fusion, FISH probe) | Localising specific molecules or structures |
Confocal | Point (usually laser) illumination is scanned across the sample, and a pinhole placed in a plane conjugate to the focal plane rejects out-of-focus light, giving thin optical sections | Usually combined with fluorescent labelling; can image living specimens | 3D reconstruction (z-stacks) of thick specimens; removes out-of-focus blur |
An epifluorescence microscope uses an excitation filter to select the excitation wavelength, a dichroic mirror that reflects excitation light onto the specimen and transmits the longer-wavelength emission, and an emission (barrier) filter that passes only the fluorescence to the detector. In ordinary (one-photon) fluorescence the emitted light has a longer wavelength (lower energy) than the excitation light; this difference is the Stokes shift, caused mainly by vibrational (and solvent) relaxation in the excited state before emission. The exception is multiphoton (two-photon) excitation, where two long-wavelength photons are absorbed together, so the excitation wavelength is longer than the emission.
A confocal microscope removes out-of-focus haze by illuminating and detecting one point at a time and physically blocking light from outside the focal plane with the pinhole. Stepping the focal plane through the specimen gives a z-stack of optical sections that can be reconstructed into a 3D image — without physically cutting the sample.
EXAM TIP
Live, unstained, transparent cells needing contrast → phase-contrast (or dark-field for very thin, scattering organisms). A specific molecule tagged, dark background, only labelled structures glow → fluorescence. Add '3D optical sections / thick specimen / pinhole' → confocal.
Feature | TEM (Transmission EM) | SEM (Scanning EM) |
|---|---|---|
What is imaged | Internal ultrastructure — the electron beam passes THROUGH an ultrathin section; regions stained with heavy metals scatter electrons and appear dark | Surface topography — a focused beam is scanned across the surface and the secondary electrons (and backscattered electrons) emitted from the specimen are detected |
Sample preparation | Fixation (e.g. glutaraldehyde, osmium tetroxide), dehydration, resin embedding, ultrathin sectioning (tens of nm), heavy-metal staining (e.g. uranyl acetate, lead citrate); isolated particles can instead be negatively stained | Fixation, dehydration (e.g. critical-point drying), coating with a thin conductive metal layer (e.g. gold) |
Image nature | 2D projection of internal structure (e.g. organelles, viral capsids) | 3D-looking surface image (e.g. cell surfaces, spores, pili) |
Resolution | Instrumental limit about 0.1–0.2 nm; for conventionally stained biological sections, practically a few nm, limited by the specimen | Lower than TEM (nanometre range), with a large depth of field |
Conventional TEM and SEM operate with the specimen in a vacuum (air molecules scatter electrons), and the fixation and dehydration steps kill the cell, so they cannot image living cells the way light or confocal microscopy can. Cryo-electron microscopy keeps specimens hydrated by flash-freezing them in vitreous (non-crystalline) ice, but the specimens are still not alive. Negative staining surrounds an isolated particle (e.g. a virus) with an electron-dense heavy-metal salt, so the particle appears light against a dark background.
ENERGY OF ELECTROMAGNETIC RADIATION
= Planck's constant; = frequency; = speed of light; = wavelength; = wavenumber (usually in ). Shorter wavelength = higher energy.
Region | Approximate range | What the radiation does | Techniques |
|---|---|---|---|
Ultraviolet | about 190–400 nm | Electronic transitions (peptide bonds, aromatic side chains, nucleic-acid bases) | UV absorption, far-UV and near-UV CD, excitation in fluorescence |
Visible | about 400–700 nm | Electronic transitions in coloured compounds and dyes | Colorimetric assays, fluorescence emission |
Infrared (mid-IR) | about 2.5–25 µm (4000–400 ) | Bond vibrations (stretching, bending) | IR, FT-IR |
Radiofrequency, in a strong magnetic field | MHz range | Transitions between nuclear spin states | NMR |
Mass spectrometry is not an absorption technique: it measures the mass-to-charge ratio () of ions moving in electric and/or magnetic fields.
ABSORBANCE AND TRANSMITTANCE
= intensity of light entering the sample; = intensity transmitted; = transmittance. Absorbance is dimensionless. Example: gives ; gives .
BEER–LAMBERT LAW
= absorbance (dimensionless); = molar absorption (extinction) coefficient in , specific to the molecule, wavelength and solvent; = molar concentration (M = mol ); = path length (cm; a standard cuvette is 1 cm). Holds for monochromatic light in dilute, non-scattering solutions, within the linear range of the instrument — at high absorbance (often above about 1) the response deviates from linearity and the sample should be diluted. For a mixture of non-interacting absorbers, absorbances at a given wavelength add.
Nucleic acids absorb maximally near 260 nm (the aromatic purine and pyrimidine bases); proteins absorb near 280 nm (mainly tryptophan and tyrosine side chains), and the peptide bond itself absorbs strongly below about 230 nm. Glass and most plastics absorb in the UV, so UV measurements use quartz cuvettes. When double-stranded DNA is denatured to single strands, rises (the hyperchromic effect) — the basis of following DNA melting spectrophotometrically.
NUCLEIC ACID CONCENTRATION FROM A260 (CONVENTION, 1 CM PATH)
Conventional factors : an of 1.0 in a 1 cm path corresponds to about 50 µg/mL double-stranded DNA, about 40 µg/mL RNA, and about 33 µg/mL single-stranded DNA.
NUCLEIC ACID PURITY RATIO (CONVENTION)
A rough purity indicator only. A ratio well below these values suggests protein (or phenol) contamination; a DNA preparation reading near 2.0 may contain RNA. The ratio is affected by the pH of the solution. A companion check, , is about 2.0–2.2 for clean nucleic acid; lower values indicate carry-over of contaminants that absorb near 230 nm (e.g. guanidine salts, phenol, carbohydrates).
Colorimetric (visible-range) protein assays
Bradford: Coomassie Brilliant Blue G-250 binds protein and its absorbance maximum shifts from about 465 nm to about 595 nm; read at 595 nm.
BCA (bicinchoninic acid): protein reduces to , which forms a purple complex with BCA; read at 562 nm.
Both are read against a standard curve prepared with a reference protein (e.g. bovine serum albumin), because the colour yield varies from protein to protein.
Fluorescence spectroscopy measures light emitted by a fluorophore after it absorbs light at a shorter (excitation) wavelength. It is far more sensitive than UV-visible absorption because emitted photons are measured against a dark background, rather than as a small drop in a bright transmitted beam. It is used to quantify labelled molecules, to monitor binding and conformational change, and in FRET-based assays.
FLUORESCENCE QUANTUM YIELD
. Quenching (by collision with a quencher, or by energy transfer) lowers the quantum yield.
FRET EFFICIENCY
= efficiency of energy transfer from donor to acceptor; = donor–acceptor distance; = Förster distance, the distance at which (typically a few nanometres). Requires overlap of the donor emission spectrum with the acceptor excitation spectrum. The sixth-power dependence makes FRET a sensitive 'molecular ruler' over roughly 1–10 nm.
Proteins have intrinsic fluorescence, dominated by tryptophan (excitation around 280–295 nm; 295 nm excites tryptophan selectively; emission roughly 300–350 nm). A tryptophan buried in a non-polar protein interior emits at a shorter wavelength (blue-shifted); on unfolding it becomes exposed to water and its emission shifts to longer wavelength (red shift) — used to follow folding and unfolding.
CIRCULAR DICHROISM
, = absorbance of left- and right-circularly polarised light. is non-zero only for chiral chromophores, or chromophores in a chiral environment (e.g. peptide bonds in a folded protein, bases in a nucleic-acid helix). CD is often reported as ellipticity.
In the far-UV (about 190–250 nm) CD arises from the peptide backbone and reports secondary structure: an α-helix shows two negative minima (about 208 nm and 222 nm) and a positive maximum (about 190–193 nm); a β-sheet shows a single negative minimum (about 216–218 nm) and a positive maximum (about 195–198 nm); a random coil (unfolded protein) shows a strong negative band near 195–200 nm and little signal above about 210 nm. The near-UV CD (about 250–320 nm) arises from aromatic side chains (and disulfides) and reflects their tertiary-structure environment. Following the CD signal at 222 nm while heating tracks loss of helix (thermal unfolding). Nucleic-acid conformations (e.g. B-form vs Z-form DNA) also give distinct CD spectra. CD gives secondary-structure content, not an atomic-resolution structure, and needs no crystal.
EXAM TIP
CD tells you HOW MUCH helix, sheet or coil a protein contains (a spectral fingerprint), not atomic 3D coordinates — those need X-ray crystallography, NMR or high-resolution cryo-EM. An option pairing CD with 'atomic structure' is wrong.
Technique | Physical basis | What it tells you |
|---|---|---|
IR / FT-IR | Absorption of infrared radiation at frequencies matching bond vibrations (stretching, bending); a vibration is IR-active only if it changes the molecule's dipole moment. FT-IR records all wavelengths at once with an interferometer and converts the interferogram into a spectrum by Fourier transform — faster and with better signal-to-noise than dispersive IR | Functional groups (e.g. C=O, O–H, N–H). In proteins: amide I band (about 1600–1700 , mainly C=O stretch, sensitive to secondary structure) and amide II band (about 1510–1580 , N–H bend plus C–N stretch). Water absorbs strongly near the amide I region, so is often used as solvent |
Mass spectrometry (MS) | Molecules are ionised, and the ions are separated by mass-to-charge ratio () using electric and/or magnetic fields or their flight time | Precise molecular mass; with fragmentation (tandem MS), sequence and structural information, e.g. peptide sequencing and protein identification |
NMR | Nuclei with non-zero spin (e.g. , , , ; and have zero spin and give no signal) absorb radiofrequency energy in a strong magnetic field; the exact resonance frequency (chemical shift) depends on the local chemical environment | Atomic-level structure and dynamics of molecules in solution, without a crystal |
WAVENUMBER (IR CONVENTION)
IR spectra are plotted against wavenumber in . Example: gives (the amide I region). Wavenumber is proportional to energy.
Soft ionisation methods for large biomolecules
MALDI (Matrix-Assisted Laser Desorption/Ionisation): the sample is co-crystallised with a UV-absorbing matrix (e.g. sinapinic acid, α-cyano-4-hydroxycinnamic acid); a laser pulse desorbs and ionises the analyte with little fragmentation. It gives mainly singly charged ions (e.g. ) and, because ions are produced in pulses, it is typically paired with a time-of-flight (TOF) analyser.
ESI (Electrospray Ionisation): a solution of the sample is sprayed from a charged capillary into fine, highly charged droplets; as the solvent evaporates, multiply charged ions () are released. Multiple charging brings large proteins into a low range, and ESI couples directly to liquid chromatography (LC-MS).
Mass analysers and tandem MS
Common analysers: time-of-flight (TOF), quadrupole, ion trap, Orbitrap.
Tandem MS (MS/MS): a selected peptide ion is fragmented, mostly at peptide bonds, giving b-ions (containing the N-terminus) and y-ions (containing the C-terminus). Mass differences between consecutive ions of a series equal residue masses, which gives the sequence.
TIME-OF-FLIGHT (TOF) RELATION
= charge number; = elementary charge; = accelerating potential; = ion mass; = velocity in the field-free flight tube; = flight-tube length; = flight time. Every ion leaves the source with kinetic energy , so for the same and : at a fixed charge a heavier ion arrives later; at a fixed mass a more highly charged ion arrives sooner.
ESI CHARGE STATES (POSITIVE-ION MODE)
= neutral molecular mass (Da); = number of protons added (charge); = mass of a proton Da (often rounded to 1). For two ADJACENT peaks in the charge-state series, carries charge (given by the second formula) and carries ; then .
WORKED EXAMPLE
An ESI spectrum of a protein shows two adjacent peaks at 1001.0 and 1112.1. Taking the proton mass as 1.0 Da, find the charge on each peak and the molecular mass of the protein.
Adjacent peaks: ,
, so the peak at 1112.1 is and the peak at 1001.0 is
Check with the other peak:
Answer: Charges (at 1001.0) and (at 1112.1); Da
NMR: LARMOR FREQUENCY AND CHEMICAL SHIFT
= resonance (Larmor) frequency; = gyromagnetic ratio of the nucleus; = applied magnetic field. The chemical shift is measured relative to a reference (tetramethylsilane, TMS, set at ) and is independent of field strength. A stronger field spreads the signals further apart (better resolution and sensitivity).
For protein structure, NMR provides through-bond couplings and nuclear Overhauser effects (NOEs) between protons closer than about 5 Å (0.5 nm), which act as distance restraints; proteins are usually labelled with and for multidimensional NMR. Because large molecules tumble slowly and give broad signals, solution NMR structure determination is practical mainly for relatively small proteins.
EXAM TIP
'Atomic-level structure of a molecule in solution, no crystal needed' points to NMR. Distinguish it from cryo-EM (also needs no crystal, but images frozen particles) and from X-ray crystallography (needs a crystal).
PREVIOUS-YEAR QUESTIONS
Try each question first, then open the answer. We placed each question under a topic ourselves; the exam paper does not label topics.
See these papers in full: GATE BT 2025 · GATE BT 2024 · GATE BT 2023 · GATE BT 2022 · GATE BT 2019
The percentage of light that would pass through a sample with an absorbance of 2 would be ______% . (Round off to the nearest integer)
Let . If the eigenvalues of are , , and , then the value of is ___________. (Answer in integer)
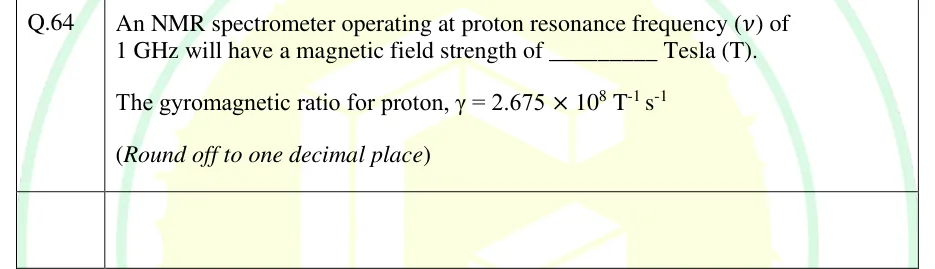
An NMR spectrometer operating at proton resonance frequency (ν) of 1 GHz will have a magnetic field strength of __________ Tesla (T).
The gyromagnetic ratio for proton, γ = 2.675 × 10^8 T^-1 s^-1
(Round off to one decimal place)
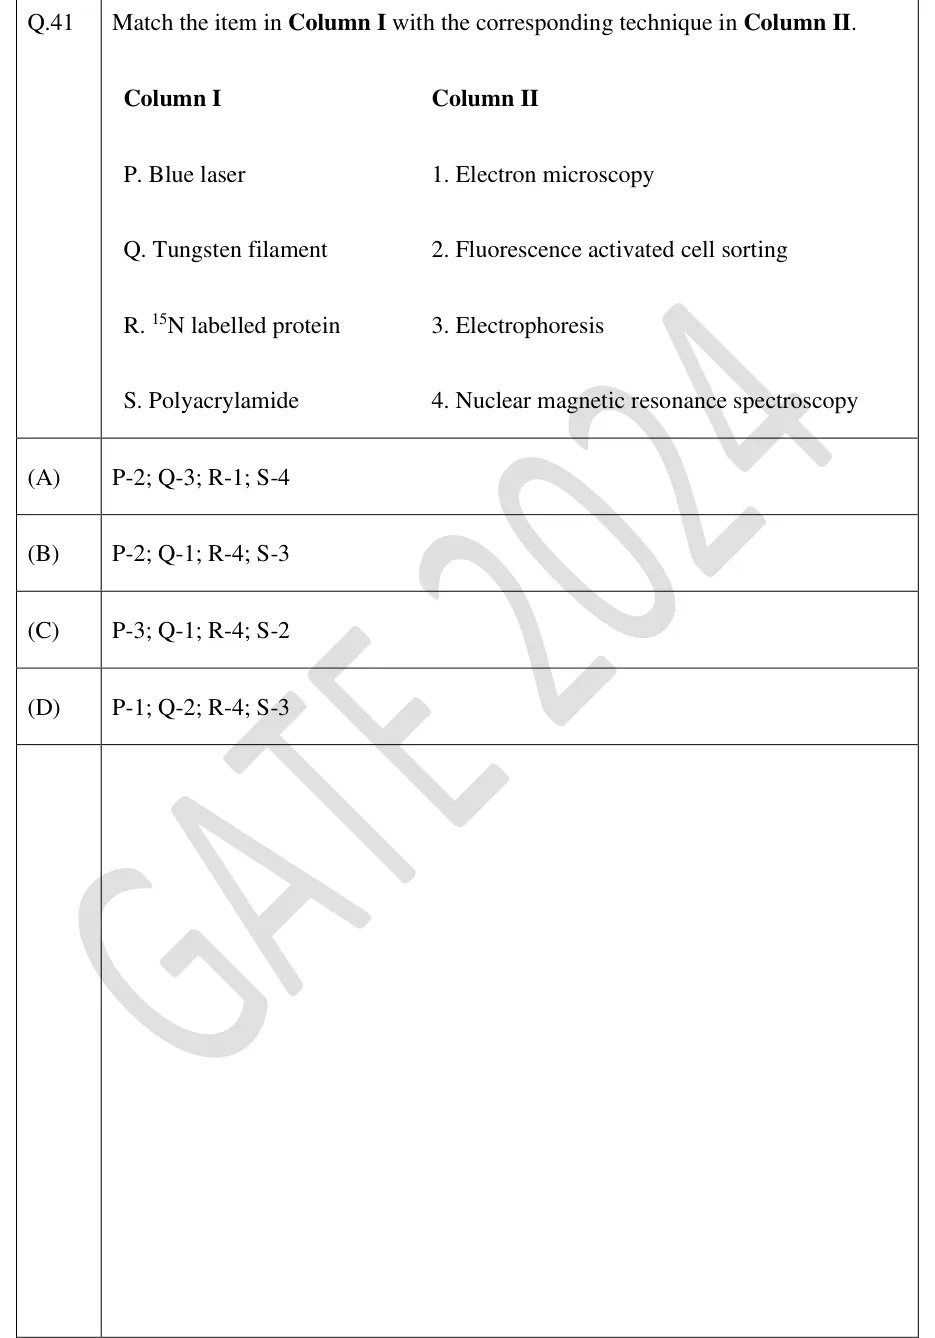
Match the item in Column I with the corresponding technique in Column II.
Column I
P. Blue laser
Q. Tungsten filament
R. N labelled protein
S. Polyacrylamide
Column II
1. Electron microscopy
2. Fluorescence activated cell sorting
3. Electrophoresis
4. Nuclear magnetic resonance spectroscopy
P-2; Q-3; R-1; S-4
P-2; Q-1; R-4; S-3
P-3; Q-1; R-4; S-2
P-1; Q-2; R-4; S-3
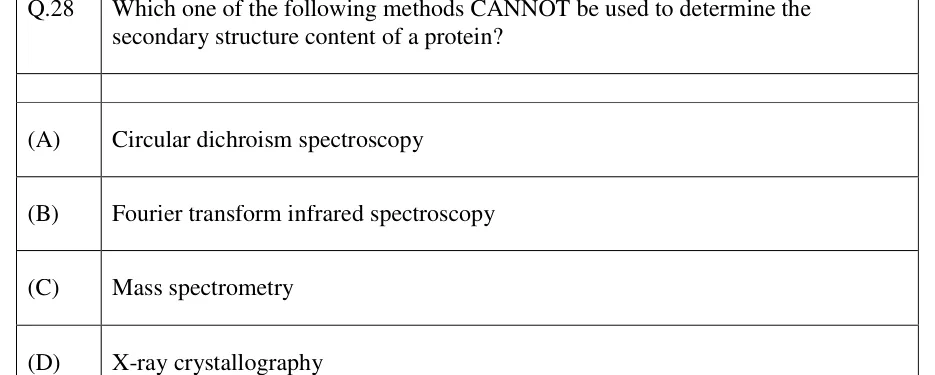
Which one of the following methods CANNOT be used to determine the secondary structure content of a protein?
Circular dichroism spectroscopy
Fourier transform infrared spectroscopy
Mass spectrometry
X-ray crystallography
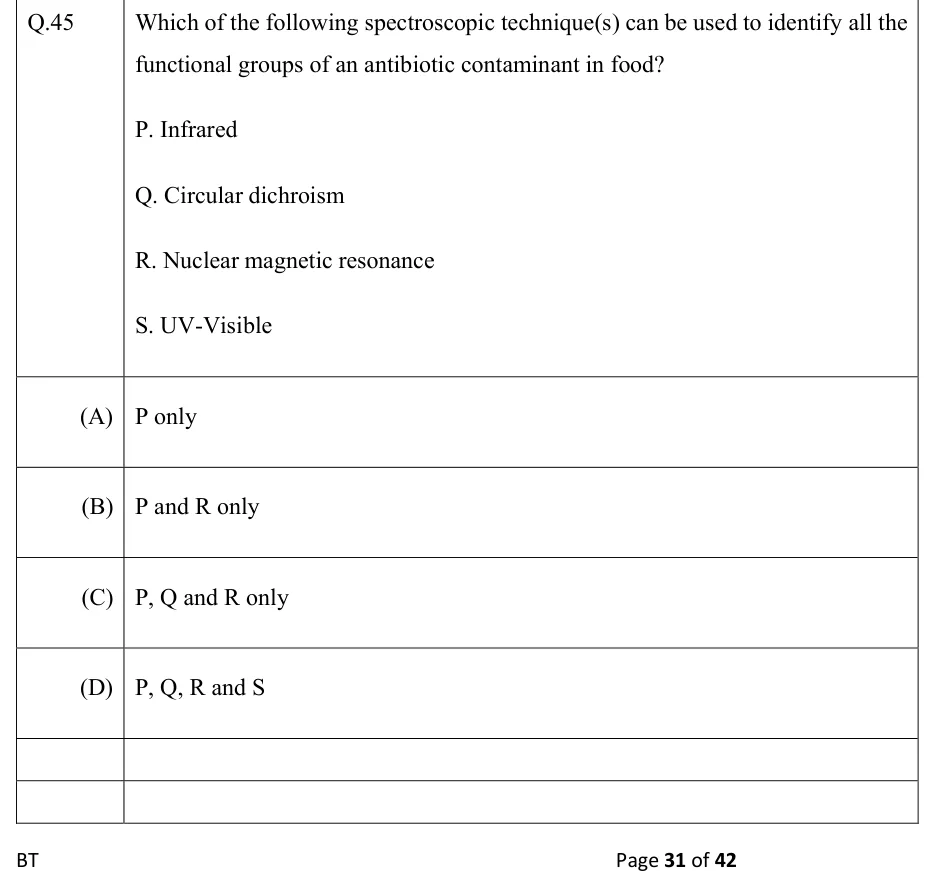
Which of the following spectroscopic technique(s) can be used to identify all the functional groups of an antibiotic contaminant in food?
P. Infrared
Q. Circular dichroism
R. Nuclear magnetic resonance
S. UV-Visible
P only
P and R only
P, Q and R only
P, Q, R and S
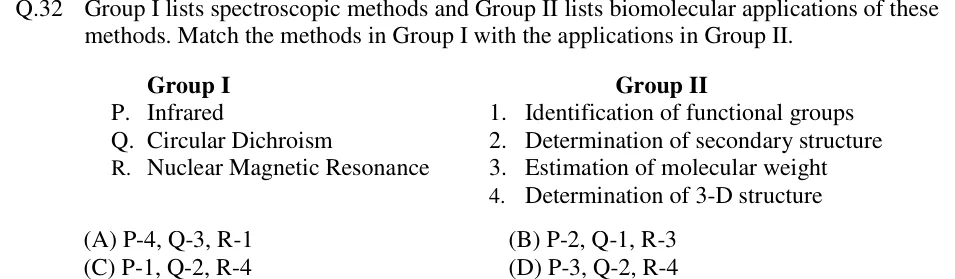
Group I lists spectroscopic methods and Group II lists biomolecular applications of these methods. Match the methods in Group I with the applications in Group II.
Group I
P. Infrared
Q. Circular Dichroism
R. Nuclear Magnetic Resonance
Group II
1. Identification of functional groups
2. Determination of secondary structure
3. Estimation of molecular weight
4. Determination of 3-D structure
P-4, Q-3, R-1
P-2, Q-1, R-3
P-1, Q-2, R-4
P-3, Q-2, R-4
A UV-visible spectrophotometer has a minimum detectable absorbance of 0.02. The minimum concentration of a protein sample that can be measured reliably in this instrument with a cuvette of 1 cm path length is _______ μM. The molar extinction coefficient of the protein is 10,000 L mol⁻¹ cm⁻¹.
PRACTICE
A protein solution shows an absorbance of 0.6 at 280 nm in a cuvette of path length 1 cm. The molar absorption coefficient of the protein at 280 nm is . What is the concentration of the protein?
Answer: (A)
Beer–Lambert law: , with in and in cm, so comes out in M
Rearranging:
A researcher wants to map the three-dimensional distribution of a GFP-tagged protein inside a thick slice of living tissue. The aim is a stack of sharp optical sections at different depths, without physically cutting the sample, that can be reconstructed digitally. Which microscopy technique is most suitable?
Confocal fluorescence microscopy
Transmission electron microscopy
Scanning electron microscopy
Bright-field light microscopy
Answer: (A)
Bright-field microscopy relies on absorption contrast and does not detect a fluorescent tag; in a thick sample, out-of-focus light blurs the image and there is no optical sectioning.
TEM needs fixed, dehydrated, ultrathin physical sections in a vacuum, so it cannot image living tissue or section it optically.
SEM images only the surface of a fixed, dried, metal-coated specimen, not the interior of living tissue.
Confocal microscopy excites the GFP with a scanned laser and uses a pinhole to reject out-of-focus light, giving thin optical sections at successive depths (a z-stack) that are reconstructed into a 3D image of living tissue.
In a MALDI-TOF mass spectrometer, an ion of mass-to-charge ratio (m/z) 5000 with charge z = 1 is accelerated through a potential difference of 20 kV and takes 30 microseconds to traverse the flight tube. A second ion of the same charge state (z = 1) has m/z = 20000. With the same accelerating voltage and the same flight tube, what is the flight time (in microseconds) of the second ion?
Answer: (accepted range )
Each ion leaves the source with kinetic energy , so and ; for fixed and , .
Ratio of times:
A DNA sample gives an absorbance of 0.40 at 260 nm and 0.20 at 280 nm, both measured in a 1 cm cuvette. What is the A260/A280 ratio, used as an indicator of nucleic acid purity?
Answer: (accepted range )
Interpretation: pure DNA reads about 1.8. A DNA preparation reading about 2.0 is not low, so it gives no sign of protein contamination, but it may indicate RNA carry-over.
A fluorescence microscope uses excitation at 488 nm and an oil-immersion objective of numerical aperture 1.40. Using the Rayleigh criterion with nm, what is the minimum resolvable distance, in nm? (Give the answer to one decimal place.)
Answer: (accepted range )
Which of the following statements about circular dichroism (CD) spectroscopy of proteins are correct?
CD relies on differential absorption of left- and right-circularly polarised light by chiral molecules
An alpha-helical protein and a beta-sheet-rich protein give distinguishable CD spectra in the far-UV region
CD directly provides atomic-resolution three-dimensional coordinates of a protein
CD measurement requires the protein sample to be crystallised first
Answer: (A), (B)
CD is the differential absorption of left- and right-circularly polarised light, which is non-zero only for chiral chromophores or chromophores in a chiral environment — A is correct.
In the far-UV, an α-helix gives negative bands near 208 and 222 nm and a positive band near 190–193 nm, while a β-sheet gives a single negative band near 216–218 nm; the spectra are distinguishable — B is correct.
CD gives secondary-structure content (helix/sheet/coil), not atomic-resolution 3D coordinates, which need X-ray crystallography, NMR or high-resolution cryo-EM — C is incorrect.
CD is measured on proteins in solution; no crystal is needed (unlike X-ray crystallography) — D is incorrect.
A double-stranded DNA stock is diluted 50-fold (10 µL of stock made up to 500 µL with buffer). The diluted sample gives in a 1 cm cuvette. Using the convention that an of 1.0 (1 cm path) corresponds to 50 µg/mL of dsDNA, what is the concentration of the undiluted stock, in µg/mL?
Answer: (accepted range )
Concentration of the diluted sample:
Dilution factor
Stock concentration:
OFFICIAL GATE 2027 SYLLABUS WORDING
Copied from the GATE 2027 syllabus; see all 2027 syllabi.
GATE BT
Principles of microscopy - light, electron, fluorescence and confocal; Principles of spectroscopy- UV, visible, fluorescence, CD, IR, FT-IR, MS, NMR
Preparing in Kolkata? IAE Academy's course for GATE BT.